How to Make an Effective Venn Diagram in Google Slides (Step-by-Step)

Staring at endless corporate spreadsheets during an executive pitch is exhausting for your stakeholders. If you want to highlight shared benefits, compare ideas, and break down complex concepts, using a Venn diagram is the ultimate presentation shortcut.
When you create a Venn diagram that is clean and well-formatted, you instantly transform dense, intimidating data dumps into clear strategic insights. It allows your audience to easily map out cross-functional relationships and contrast similarities at a single glance.
This modern, step-by-step guide walks you through exactly how to make a Venn diagram natively inside your cloud presentation workspace using two primary design pathways:
- The Native Diagram Tool: Best for rapid, automated speed and quick relational data entry.
- Custom Shapes Workspace: Best for professional designers seeking total visual control over transparency, sizing, and brand-aligned aesthetics.

What is a Venn Diagram? Mapping Logical Visual Relationships
Before jumping into the software mechanics, it helps to understand what is a Venn diagram and why it carries so much weight in business communication. At its core, this framework uses intersecting fields to illustrate logical relationships between separate data groups.
First popularized by British logician John Venn in the 1880s, Venn diagrams serve as a foundational method for organizing information. They give presenters a clear graphic space to compare and contrast sets, mapping out where concepts align or separate.
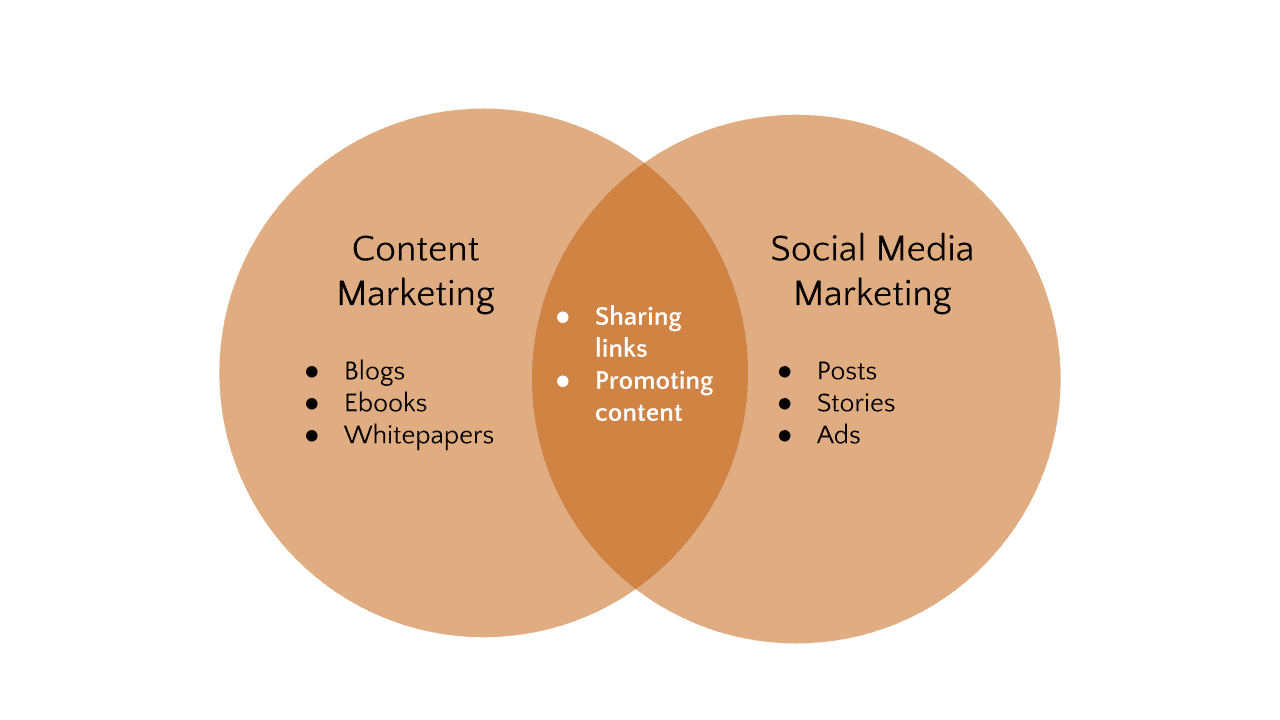
Imagine a practical corporate scenario where you are comparing two distinct social media marketing platforms for an upcoming project pitch. Instead of burying stakeholders in spreadsheets, a visual overlap immediately captures their unique traits and shared target audiences.
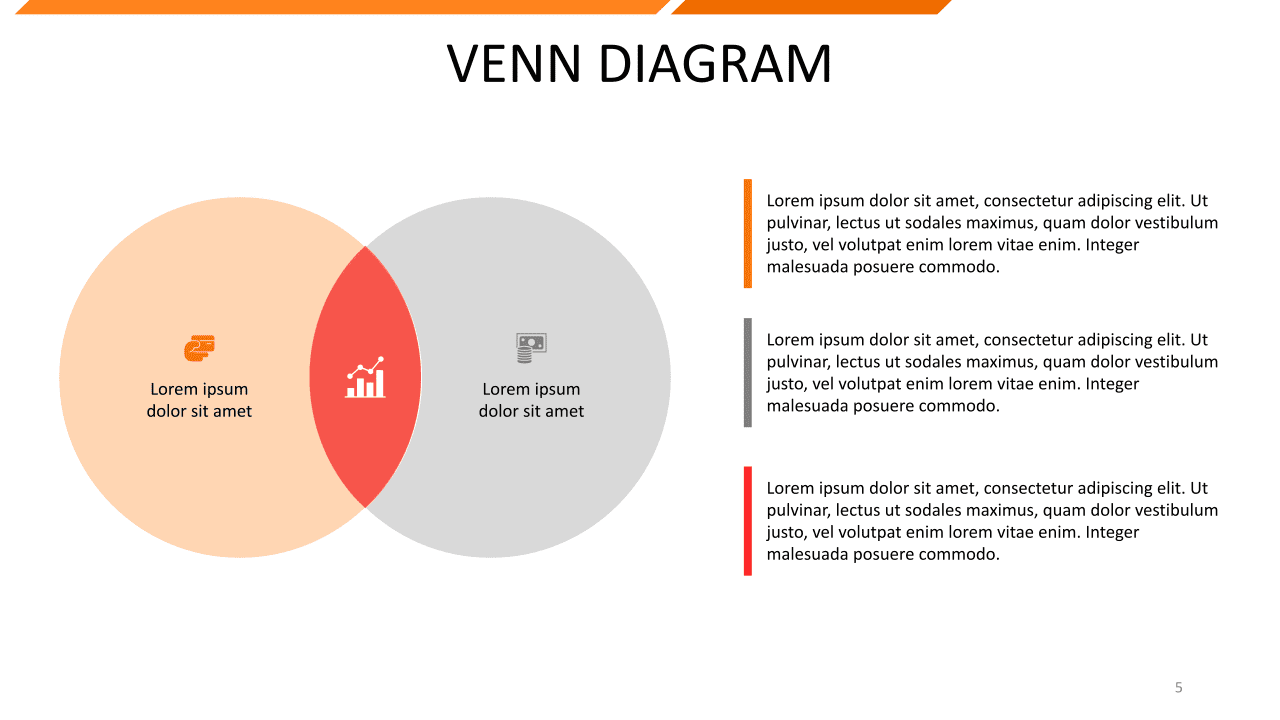
To become familiar with the structure of Venn diagrams, here are the main components every Venn diagram should have:
- Set: A collection of items.
- Elements: The items in a set.
- Intersection: The area with common elements from two or more sets.
- Universal set: All the elements in the diagram (usually drawn as a rectangle around the sets).
When making your Venn diagrams in Google Slides, remember:
- Each circle represents a set of elements.
- Each overlapping area shows the relationships between elements from different sets.
How to Create a Venn Diagram in Google Slides
To start a Venn diagram from scratch, building a Google Slides Venn diagram is highly intuitive and handled entirely inside your web browser. The native cloud workspace gives you two options: The diagram tool and the shape tool.
When structuring a professional Venn diagram in Google Slides, selecting the ideal design pathway depends completely on your specific presentation timeline:
Method 1: Use the Diagram Tool (Easiest Way)
If you need to build a rapid data layout, learning how to insert a Venn diagram in Google Presentations takes less than a minute using native menu tools. This automated pathway lets you deploy a clean three-circle Venn diagram framework without tedious manual shape dragging.
Here is exactly how to add a Venn diagram in Google Slides Workspaces step-by-step:
- Step 1: Go to Insert > Diagram and choose the Relationship category. A sidebar will appear with several options.
- Step 2: Choose the number of areas for your diagram from the “Areas” drop-down menu. You can also select your colors next to it.
- Step 3: Pick the option for a Venn diagram.
To show relationships in your Venn diagram, adjust the transparency using the Fill Color option.
- Step 4: Select the Venn diagram and go to Fill color. Then, choose "Transparent" for a fully clear diagram or "Custom" to add a color with transparency.
In this example, I'll use the custom option to adjust the color transparency.
- Step 5: Finally, customize your Venn diagram and text boxes using the formatting options in the top menu bar. Adjust colors, borders, and text as needed.
To add text, go to Insert > Text box.
Pro Tip: For better clarity, remove the borders and make the text boxes transparent. Remember to use the guide lines to ensure everything is aligned.
Here’s a Venn diagram example comparing AI tools:
Customizing your Google Slides Venn diagram lets you focus your audience’s attention exactly where you want it—just like the pros! If you want some inspiration, check out some presentation examples by the 24Slides designers:
Method 2: Use Google Slides Shapes (Like a Pro)
While the automated diagram tool is faster, building a blank Venn diagram from scratch offers complete styling freedom. This is the exact strategy professional presentation designers use to fit custom corporate branding rules.
Follow these steps to discover how to create a Venn diagram in Google shapes:
- Step 1: Go to Insert > Shape > Shapes and select the oval.
- Step 2: Hold Shift to draw a perfect circle. Copy and paste it as needed, overlapping the circles to form your diagram.
To align the circles correctly, use the guidelines.
Now, we need some transparency to highlight the overlapping areas clearly.
- Step 4: Select all the circles and go to Fill color > Custom. Click on the + sign, and adjust your Venn diagram's color and transparency.
Pro tip: Match the colors to your presentation’s palette to ensure brand consistency. Use the Eyedropper tool in the Fill Color menu to select them easily.
- Step 5: Add text boxes. Go to Insert > Text Box. Then, click and drag a text box onto the diagram and type your text. Finally, adjust the font size and colors, and align the design with the guidelines.
Tip: To improve clarity, remove the borders. Select your Venn diagram, go to Border color in the top menu, and choose Transparent.
"This is an example of a Google Slides Venn Diagram showing the overlap and differences between content marketing and social media marketing."
How to Insert a Venn Diagram in Google Slides Using Templates
When you are facing a tight corporate deadline, you do not have to design intricate graphics from scratch. Utilizing a professional Venn diagram template allows you to scale your production speed significantly by instantly downloading pre-built, multi-set slide assets directly from the 24Slides platform.
To streamline your cloud platform integration, the setup process takes only a couple of clicks:
- Step 1: Head over to the 24Slides presentation template hub and locate your preferred free Venn diagram template layout. For this example, we’ll use our Google Slides Venn diagram template.
- Step 2: Click on the green "Use Google Slides Theme" button visible on the product preview page.
- Step 3: The cloud ecosystem will immediately duplicate the pre-made slides directly into your active workspace as a fully editable file.
If you decide to go for this template, you just need to click on the “Use Google Slides Theme,” and it will open in Google Slides immediately.
However, if you have a Venn diagram PowerPoint template, you can also work with that on Google slides. So, how to use a PowerPoint template in Google Slides? First, go to File > Import Slides. Then, upload your template. You’ll get a visualization of all the slides in that file, so you can select which ones you want to use. Finally, click on Import slides.
And that’s it! Simply add your information. You can also use the template example above with the PowerPoint Venn diagram.
So next time someone asks you how you make such great Venn diagrams in Google Slides, you can share these tricks or direct them all here. Happy presenting!
Frequently Asked Questions

How to Change Venn Diagram Color in Google Slides
To modify your color palette, click directly on the independent shape fragments or circles you want to change. Next, click Fill color on the formatting toolbar and choose Custom to adjust the tone.
Sliding the transparency bar guarantees your overlapping data segments remain completely visible.
How to Add Text to Overlapping Circles in Google Slides
Typing directly inside a circle often distorts the shape or cuts off letters awkwardly. To place descriptions inside tight intersections, you must use standalone, borderless text boxes:
- Navigate to the top menu and click Insert > Text Box.
- Draw a tiny text frame precisely over the overlapping graphic area.
- Type your data and change the box fill and border to transparent.
How to make a Venn diagram on Google Slides?
Go to Insert > Diagram and select the Relationship category. Then, choose the number of areas and colors for your diagram. Finally, choose the option for a Venn diagram.
If you need more design flexibility, I recommend using Google Slides Shapes.
How do you change the color of a Venn diagram in Google Slides?
Select all the elements and go to Fill color > Custom. Here, you can adjust the tone of your Venn diagram.
How can I adjust the transparency of shapes in a Google Slides Venn diagram?
Select all the circles, then navigate to Fill color > Custom. Click the + icon to adjust the colors and transparency of your Venn diagram.
How do you add text to a Google Slides Venn diagram?
Go to Insert > Text Box. Then, click where you want to add the text and type your text. Finally, adjust the format using the toolbar.
Can I use images instead of text labels in a Google Slides Venn diagram?
Yes, you can use images as labels in your Venn diagram. To do this, go to Insert > Image and select an image source (upload, web search, etc.). Finally, resize the images and place them in the desired areas of the circles.
Turn your ideas into stunning visuals with 24Slides
Creating a Venn diagram in Google Slides is a great way to visually present ideas. However, to truly leave a lasting impression, you'll need more than just that. That’s where 24Slides can make all the difference.
Creating a polished Venn diagram template or bespoke corporate layout takes time that busy professionals simply do not have. Stop wrestling with manual shape formatting when you have strict presentation deadlines to meet.
Partner with an enterprise design agency that guarantees boardroom-ready results:
- 12-Year Industry Footprint: Over a decade of dedicated presentation expertise trusted by top global brands.
- 200+ Design Specialists: A massive, global workspace of expert designers working around the clock.
- Tailored Brand Consistency: Every layout is built to reflect your exact corporate style guidelines.
Ready to elevate your deck's production value? Take advantage of our signature introductory trial. We will transform your complex draft slide into a custom corporate masterpiece for just $1

Want to enhance your PowerPoint skills? Explore this content!
- PowerPoint Charts, Graphs, & Tables Made Easy | Tips & Tricks
- Mastering the Art of Presenting Data in PowerPoint
- PowerPoint 101: The Ultimate Guide for Beginners
- How to Create a Pie Chart in PowerPoint (+Free Templates)
- How to Make a Timeline in PowerPoint? Step by step
- How to Remove Background From Image in PowerPoint (Step-by-Step Guide)
- How to Use PowerPoint Speaker Coach for Flawless Presentations