How to Make a Bar Graph on Google Slides: Quick Guide

Want to make your presentations more engaging? This quick guide will show you how to make a bar graph on Google Slides step-by-step.
A bar chart is the most effective way to present data side by side. Whether you’re making comparisons or visualizing trends, a well-designed bar chart can make your slides more impactful.
Follow along to learn how to insert and customize a bar chart in Google Slides effortlessly. Let’s dive in!

Here are the topics we'll cover:
- How to create a bar graph on Google Slides
- How to edit a bar chart in Google Slides?
- Frequently Asked Questions
- Turn ordinary slides into stunning presentations with 24Slides
How to create a bar graph on Google Slides
Here’s how to make a bar graph on Google Slides in just three simple steps!
Step 1: Insert the Bar Chart
- Select the slide to place your bar chart.
- Go to Insert > Chart. Then, choose the Bar Chart option.

Step 2: Add and Edit Data
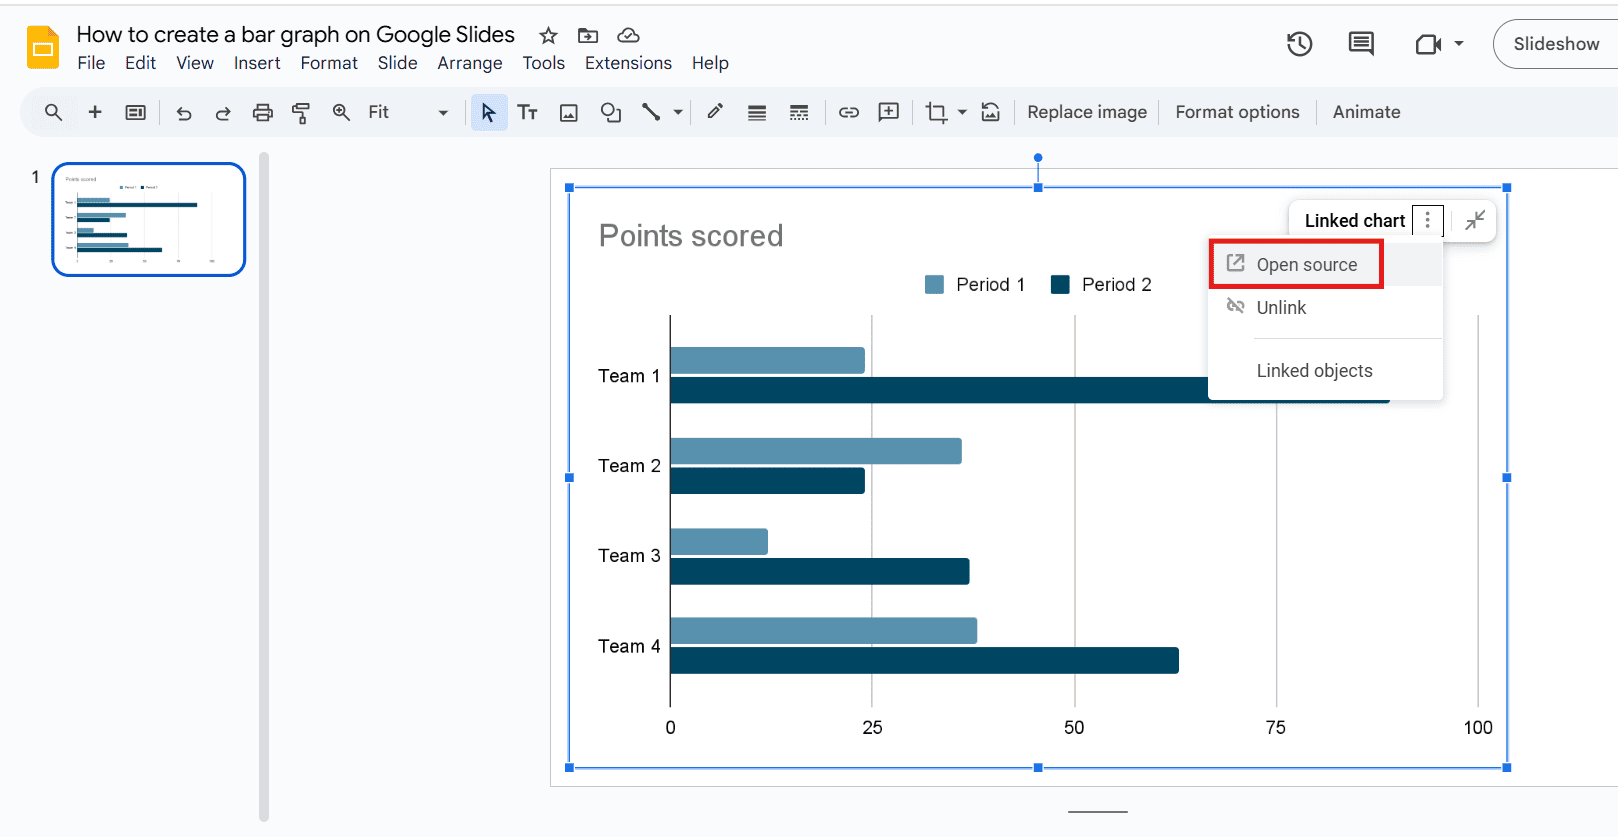
- Click the bar chart to select it. Next, click the three dots in the corner and choose Open Source. This will open a linked Google Sheets with default data.
- Replace the default data with your own. Enter categories in the first column and values in the other columns. Click Update to refresh the bar graph on Google Slides.

Pro tip: "When working with multiple charts, create them in Google Sheets first, then link them to Google Slides. This is especially helpful for large data sets." Rodrigo Valle/ Expert Designer
Step 3: Customize your Bar Chart
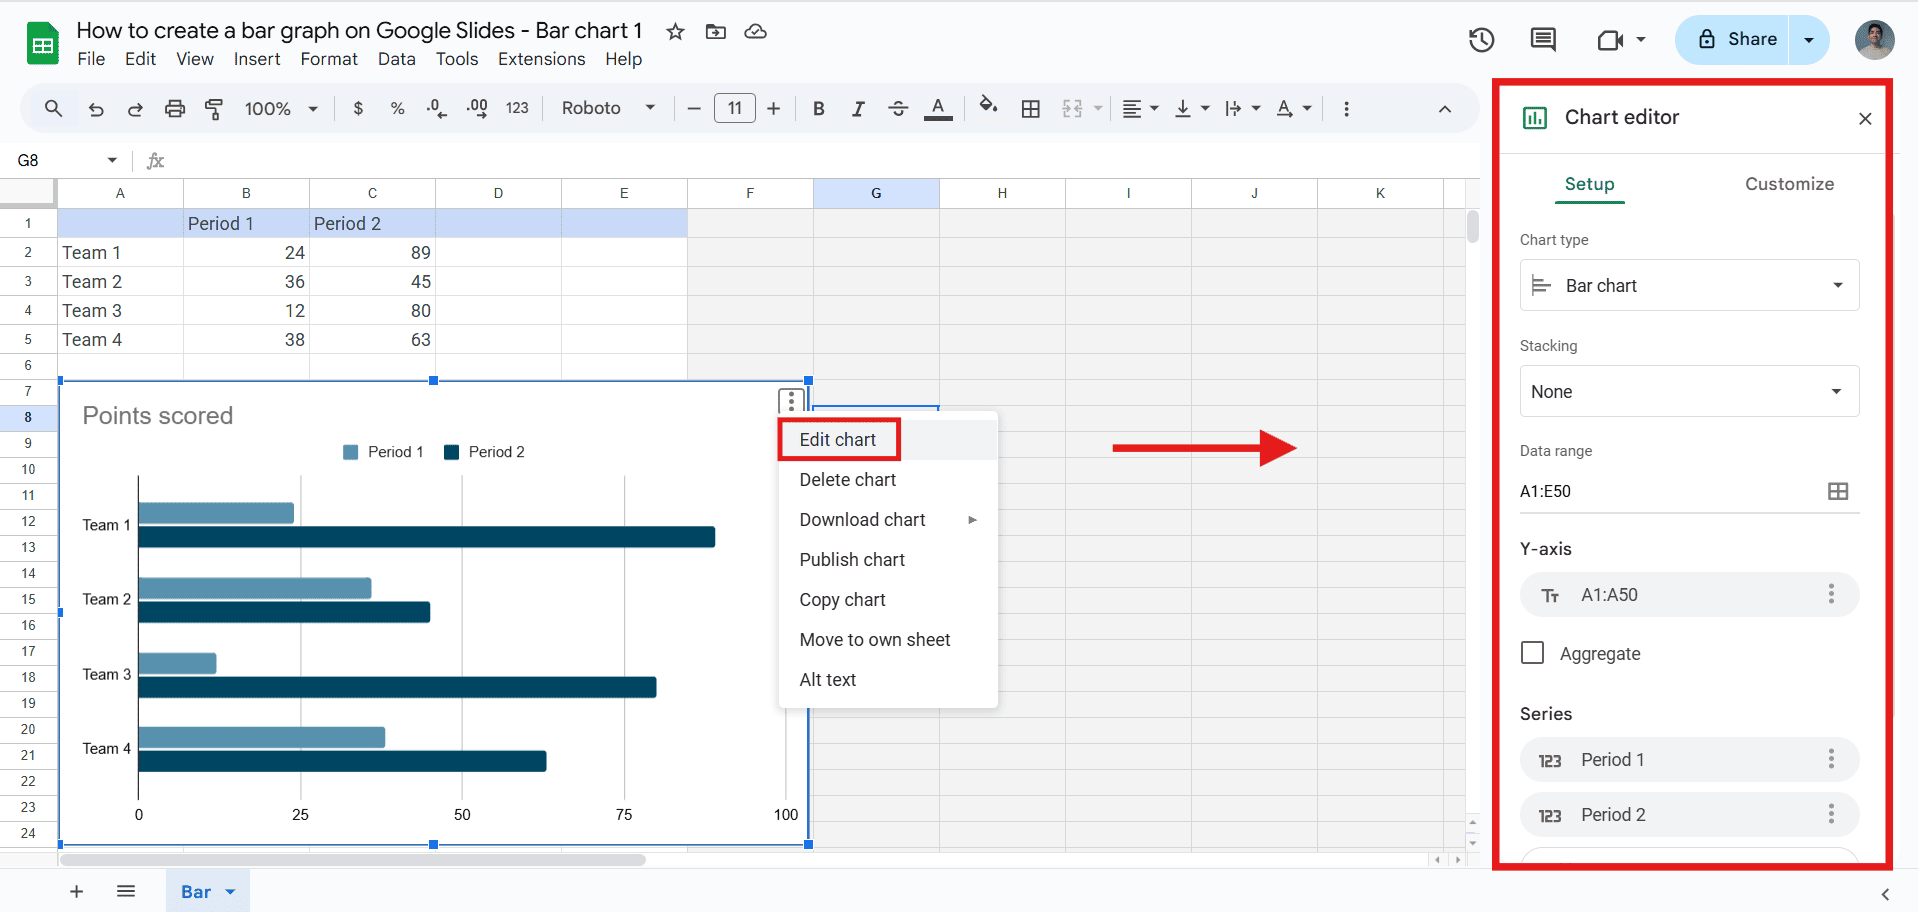
- In the Google Sheets document, click the bar chart to select it.
- Then, click the three dots in the corner and select Edit Chart. This will open the Chart Editor. Once done, click Update in Google Slides to apply your changes.
In this section, you can adjust chart elements, change styles and colors, and include data labels.
Note: You must open and edit the chart in Google Sheets to access the most important editing options, such as modifying data and chart styles.
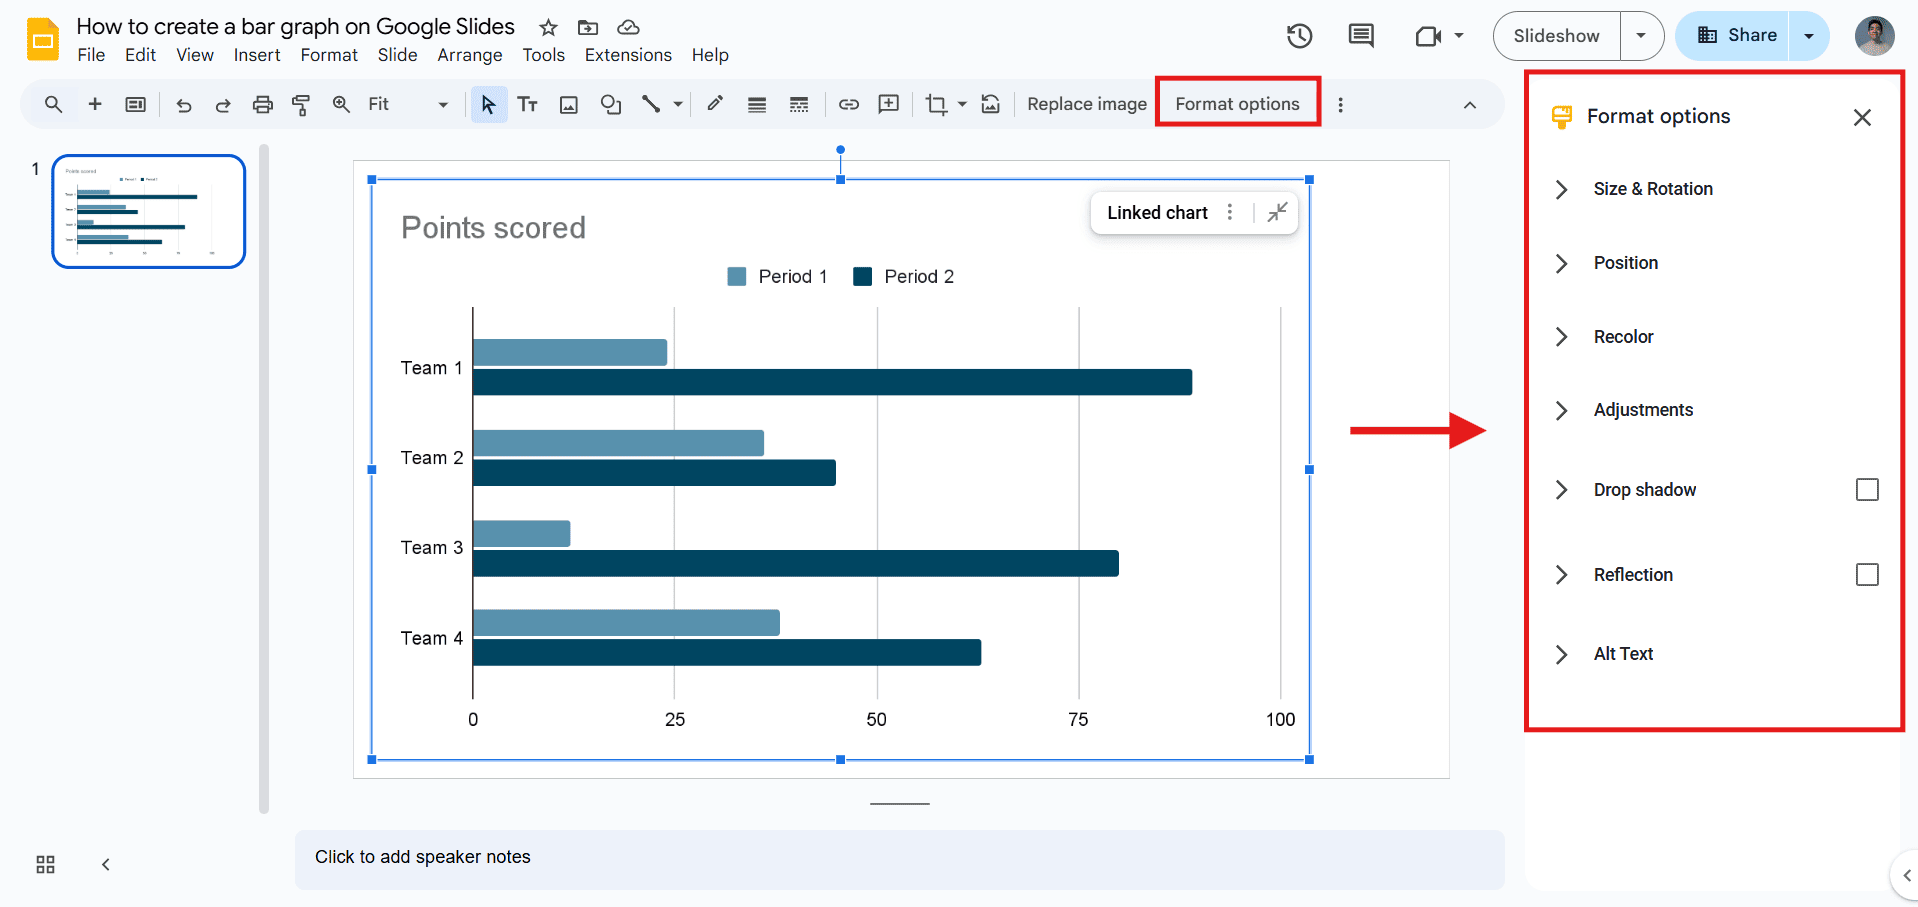
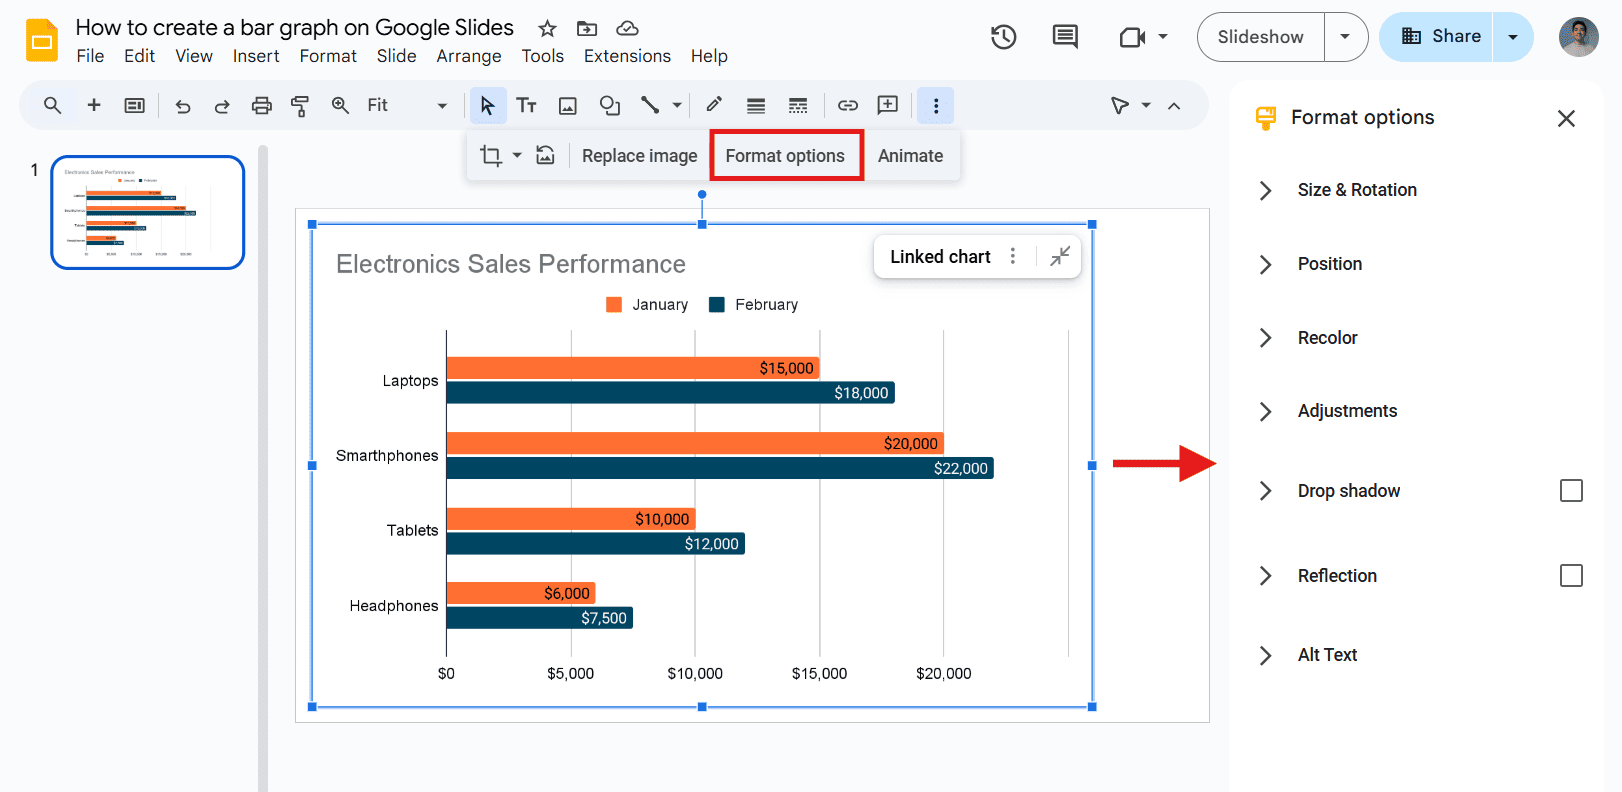
- Finally, you can use Google Slides to make small visual changes unrelated to the data. Select your bar chart and click Format Options in the toolbar.
From here, you will find additional options to better match your presentation style.
And there you have it! Now, we will explore additional options to enhance your bar chart.
How to edit a bar chart in Google Slides?
Customizing your bar chart improves data visualization and engagement. Let’s explore how with a simple real-world example:
Imagine you work at an electronics store and need to compare monthly sales of different items. A bar chart can help visualize which product category performs best, making it easier to adjust marketing and inventory strategies.
Step 1: Edit Data
- Select your bar chart, click the three dots in the corner, and choose Open Source. This will open a Google Sheets document.
- Replace the default data with your own. Once done, return to Google Slides and click Update to refresh the chart.

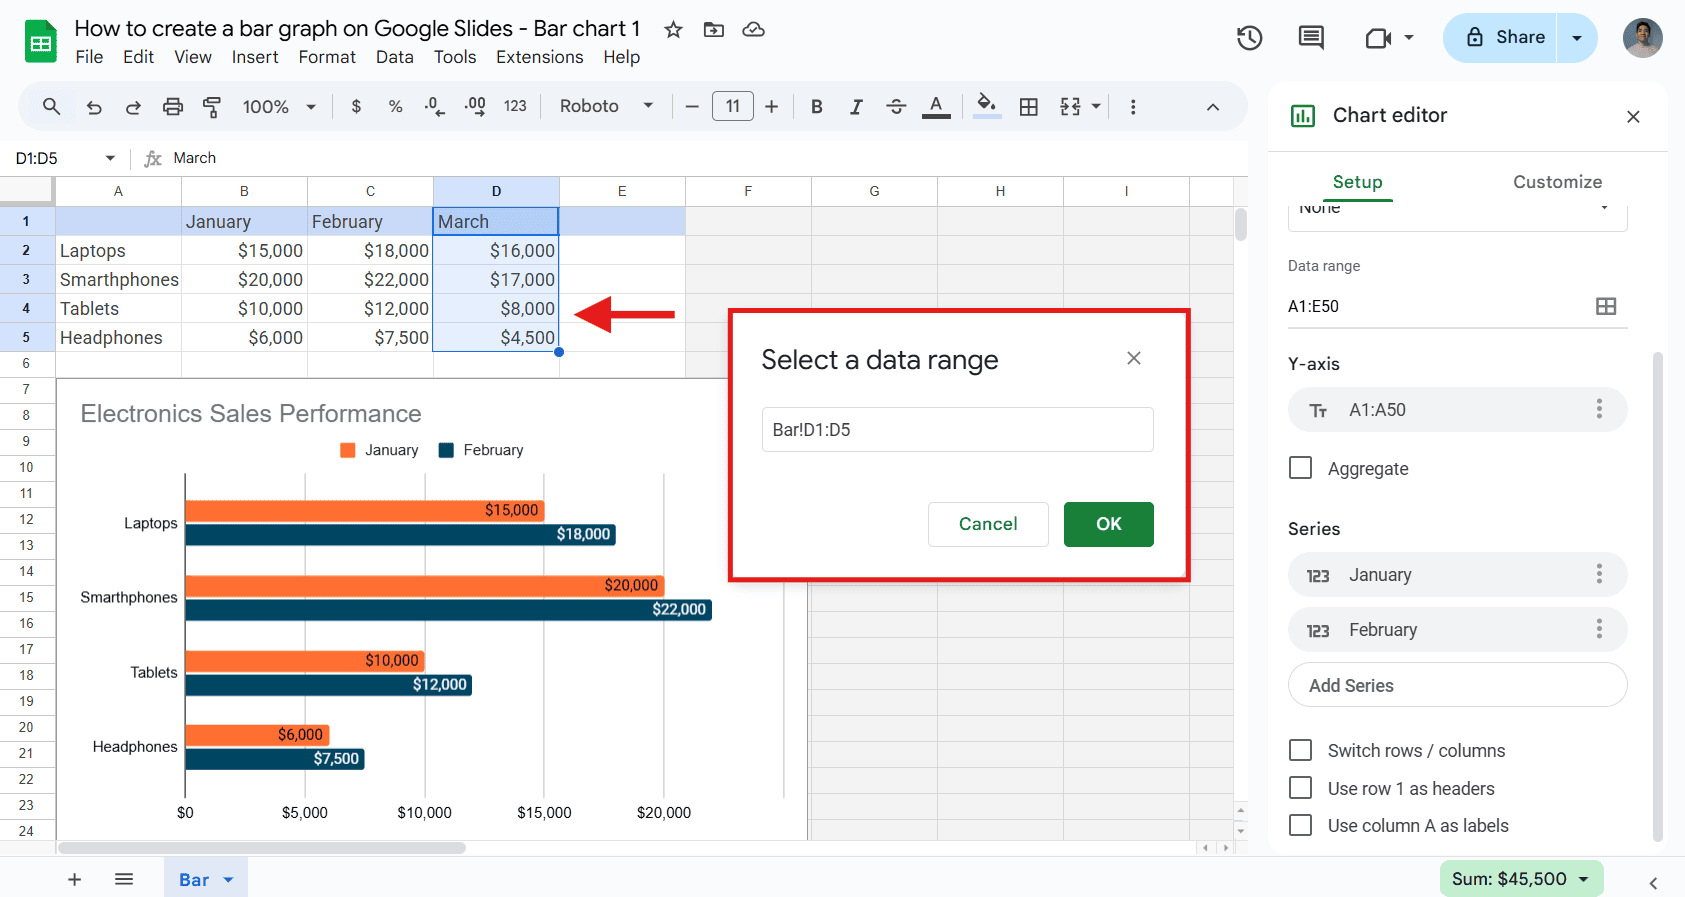
Note: To add a new data series, open the Chart Editor and go to the Setup tab. Click Add Series, choose “Select data range,” and highlight the column with your new data.
Step 2: Edit Titles & Add Labels
In Google Sheets, click the chart and then the three dots in the corner. Select Edit Chart to open the Chart Editor.
- To edit titles, go to Customize > Chart & Axis Titles and choose an option to edit.
- To add data labels, go to Customize > Series and check Data labels.

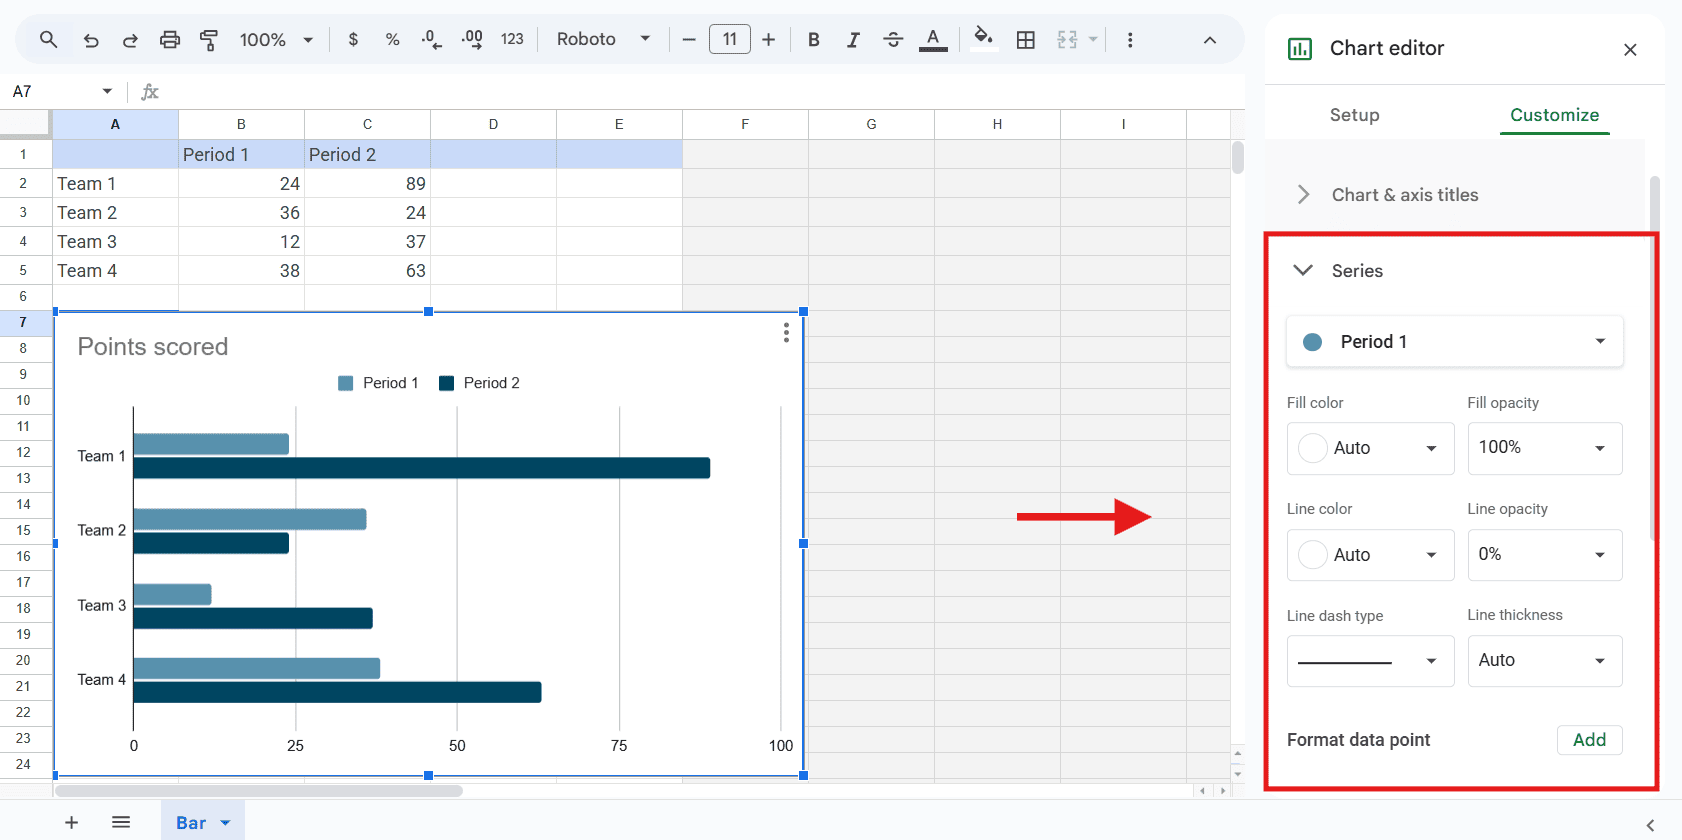
Step 3: Adjust the Colors
- Select the chart, click the three dots in the corner, and select Edit Chart to open the Chart Editor.
- Then, click on the Customize tab. Under Series, select a data series and click the color palette to change its color.
- Finally, click Update in Google Slides to refresh the chart.
Tip: The Chart Editor offers many options to enhance your bar chart. For example, in the Chart Style section, you can change the background and border color or make your bar chart 3D.

Step 4: Use the “Format Options” Tab (optional)
To make small visual adjustments, use Format Options in Google Slides. Follow these steps:
- Select your bar chart and click Format Options in the toolbar.
- Then, choose an option to format your chart.
For more details, here's how to format a chart in Google Slides.
Here’s our final Google Slides bar chart! As mentioned earlier, there are plenty of options to explore—get creative and have fun!

Frequently Asked Questions
Note: You must edit the chart in Google Sheets to access key editing options, such as modifying data or chart styles.
How to make a bar graph on Google Slides?
Go to Insert > Chart > Bar. Then, enter your data in Google Sheets and customize the chart to fit your needs.
Can I add multiple series to a bar graph in Google Slides?
Yes. To do so, just follow these steps:
- In Google Sheets, select the chart, click the three dots in the corner, and choose Edit Chart. This will open the Chart Editor.
- Go to the Setup tab, click Add Series, and choose “Select data range.”
- Finally, highlight the column with your new data.
How can I customize the colors of my bar graph in Google Slides?
- In Google Sheets, double-click the chart to open the Chart editor.
- Then, go to the Customize tab. Under Series, select a data series and use the color palette to change its color.
- Click Update in Google Slides to refresh the chart.
Is it possible to insert a bar graph directly from Google Sheets into Google Slides?
Absolutely! After you create your bar chart in Google Sheets, follow these steps:
- Open your Google Slides presentation.
- Go to Insert > Chart > From Sheets.
- Select the Google Sheets file that contains your bar graph.
- Select the chart to insert and choose whether to link it for updates from Sheets.
Turn ordinary slides into stunning presentations with 24Slides
Now that you know how to make a bar graph on Google Slides, you’re one step closer to building a clear presentation. However, turning data into a great presentation goes beyond just charts.
That’s where 24Slides comes in. While Google Slides offers useful tools, 24Slides turns up the game with over 12 years of expertise in presentation design.
Our 250+ expert designers turn ordinary slides into stunning presentations. You focus on the content, and we take care of the rest. In 24 hours you will get a presentation that perfectly fits your brand and reinforces your message.
Want to make a lasting impression? Try us out for just $1. You will get a custom, one-slide presentation tailored to your brand. Don’t let this amazing deal pass you by!

Want to create better presentations in Google Slides? Start here!