How to Make a Venn Diagram in PowerPoint: Quick Guide


What is a Venn Diagram?
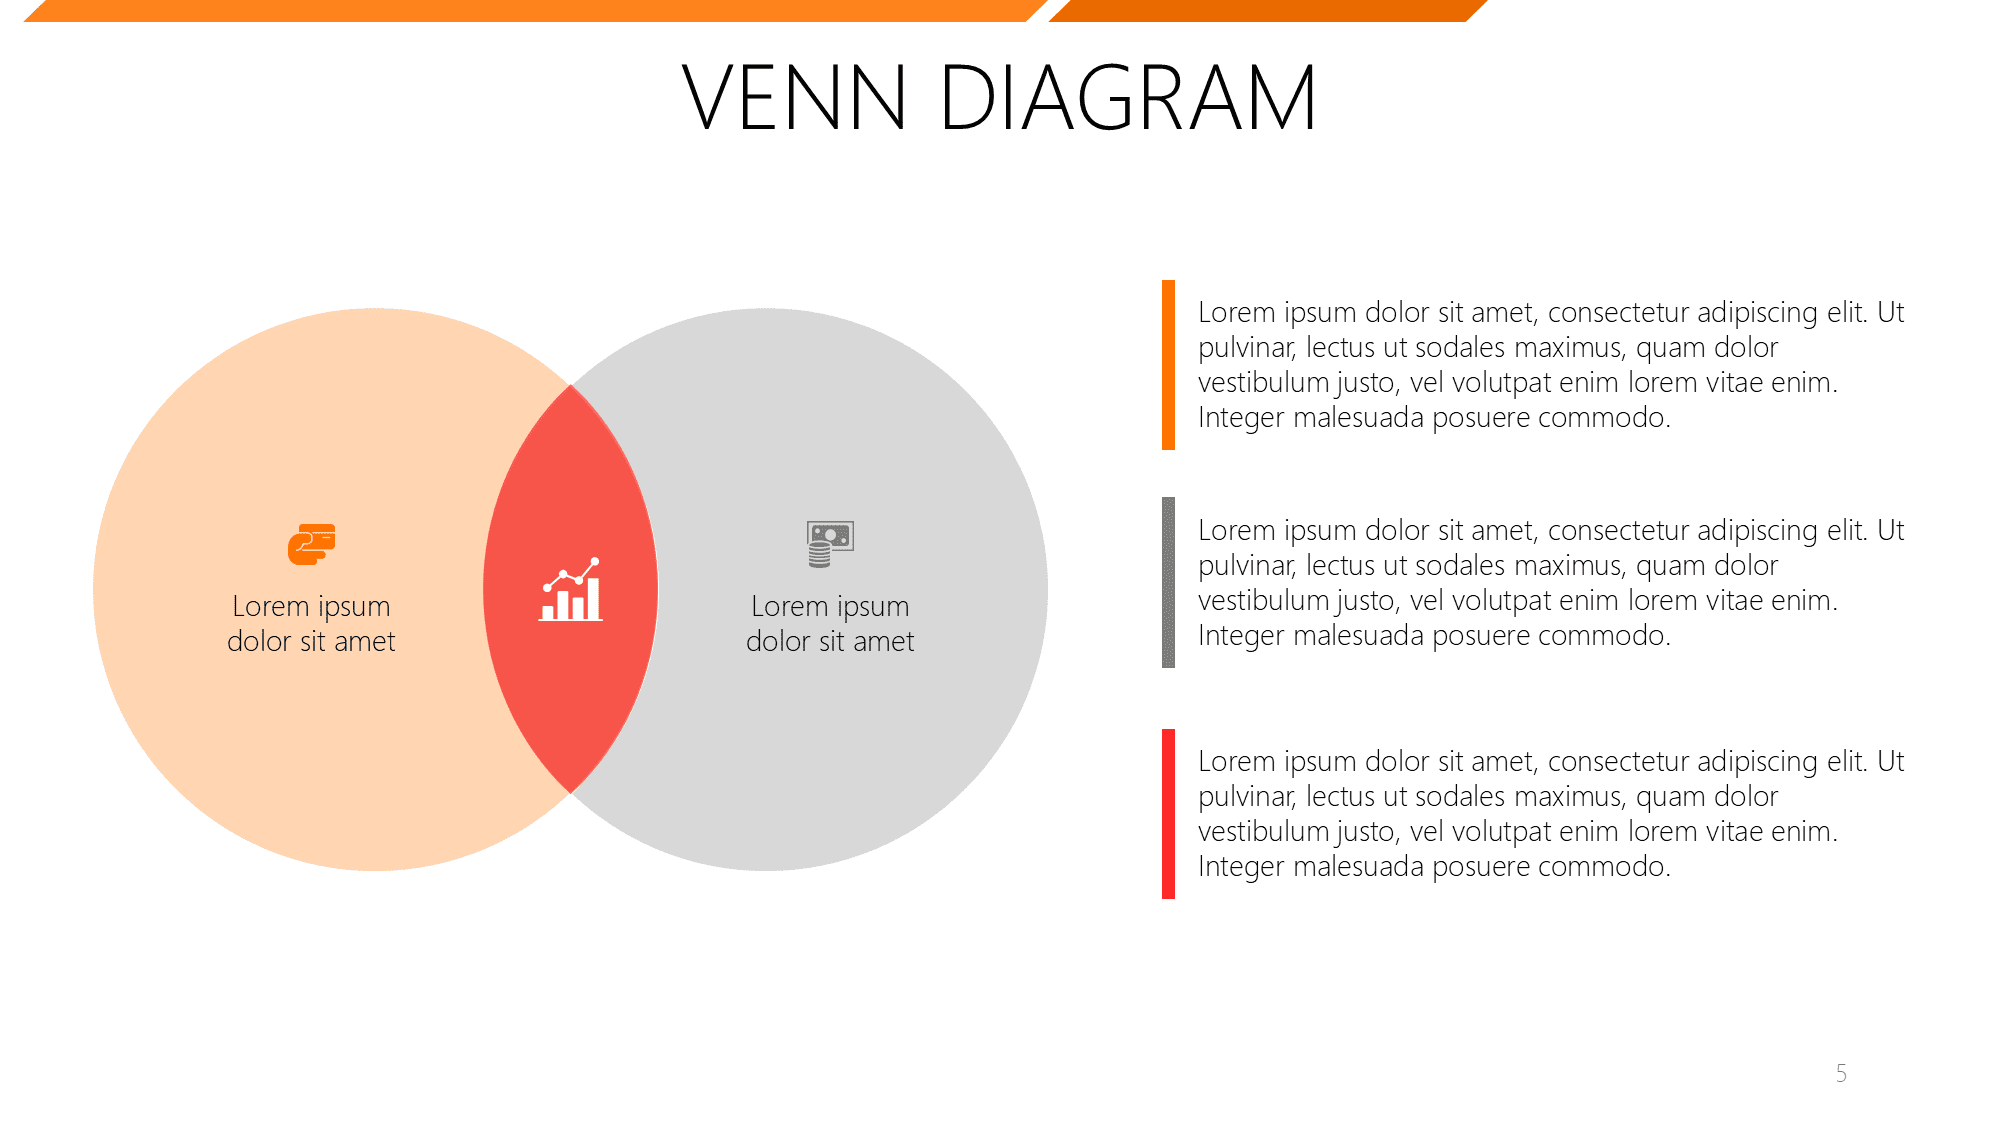
A Venn diagram is a visual representation of the relationships between groups or sets.
It uses overlapping circles to illustrate what elements belong to each group and which ones are in several sets at the same time. This way, you can easily compare and contrast the similarities and differences of things or groups of things.
Imagine you're comparing two products for your presentation. A Venn diagram helps you visually highlight their similarities and differences, making it easier for your audience to understand.
When you use Venn diagrams in your presentation workflows, complex comparisons become simple. They allow your audience to contrast similarities and differences at a single glance.
Before making a PowerPoint Venn diagram, we should become familiar with its structure. Here are the main components of every Venn diagram:
- Set: A collection of items or things.
- Elements: The items in a set.
- Intersection: All elements shared within two or more sets.
- Universal set: A grouping of all the elements in the diagram - usually represented by a rectangle around the sets.
So, to recap:
- Each circle represents a set of elements.
- Each overlapping area identifies relationships between elements of different sets.
Technical Tutorial: How to Make a Venn Diagram in PowerPoint
How do you make a Venn diagram on PowerPoint efficiently? Depending on your presentation timeline, you can deploy a clean Venn diagram in PowerPoint layouts using two primary build strategies:
- Method 1 (SmartArt Graphics): The fastest route, relying on automated relationship templates for quick data entry.
- Method 2 (Custom Shapes): The professional route, offering total control over intersection formatting and unique color styling.
Choosing Your Creation Pathway
Mastering how to make a Venn diagram in PowerPoint comes down to choosing between automated speed and total design flexibility.
When learning how to create a Venn diagram in PowerPoint, SmartArt handles text resizing automatically, but keeps you locked inside strict template rules.
In contrast, drawing custom shapes takes a few more clicks but lets you split overlapping circles into independent, uniquely styleable fragments.
Method 1: Generate a 3 Circle Venn Diagram with SmartArt Graphics
Learning how to create a Venn diagram in PowerPoint presentation decks takes less than a minute using native automated tools. This quick approach provides a structured, responsive Venn diagram for PowerPoint layouts.
Here is exactly how to insert venn diagram in PPT slides step-by-step:
- Open your presentation and navigate to your chosen slide.
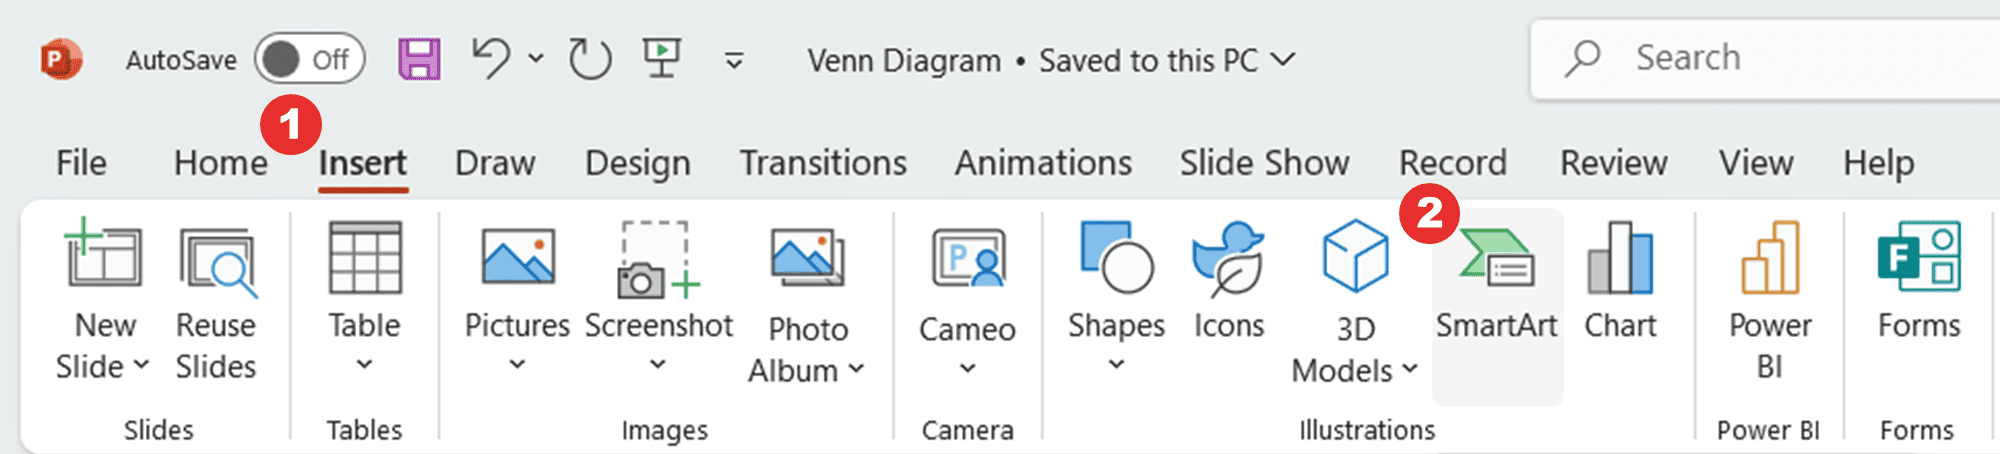
- Go to the top ribbon menu and click on the Insert tab.
- Click the SmartArt graphic icon to launch the layout window.
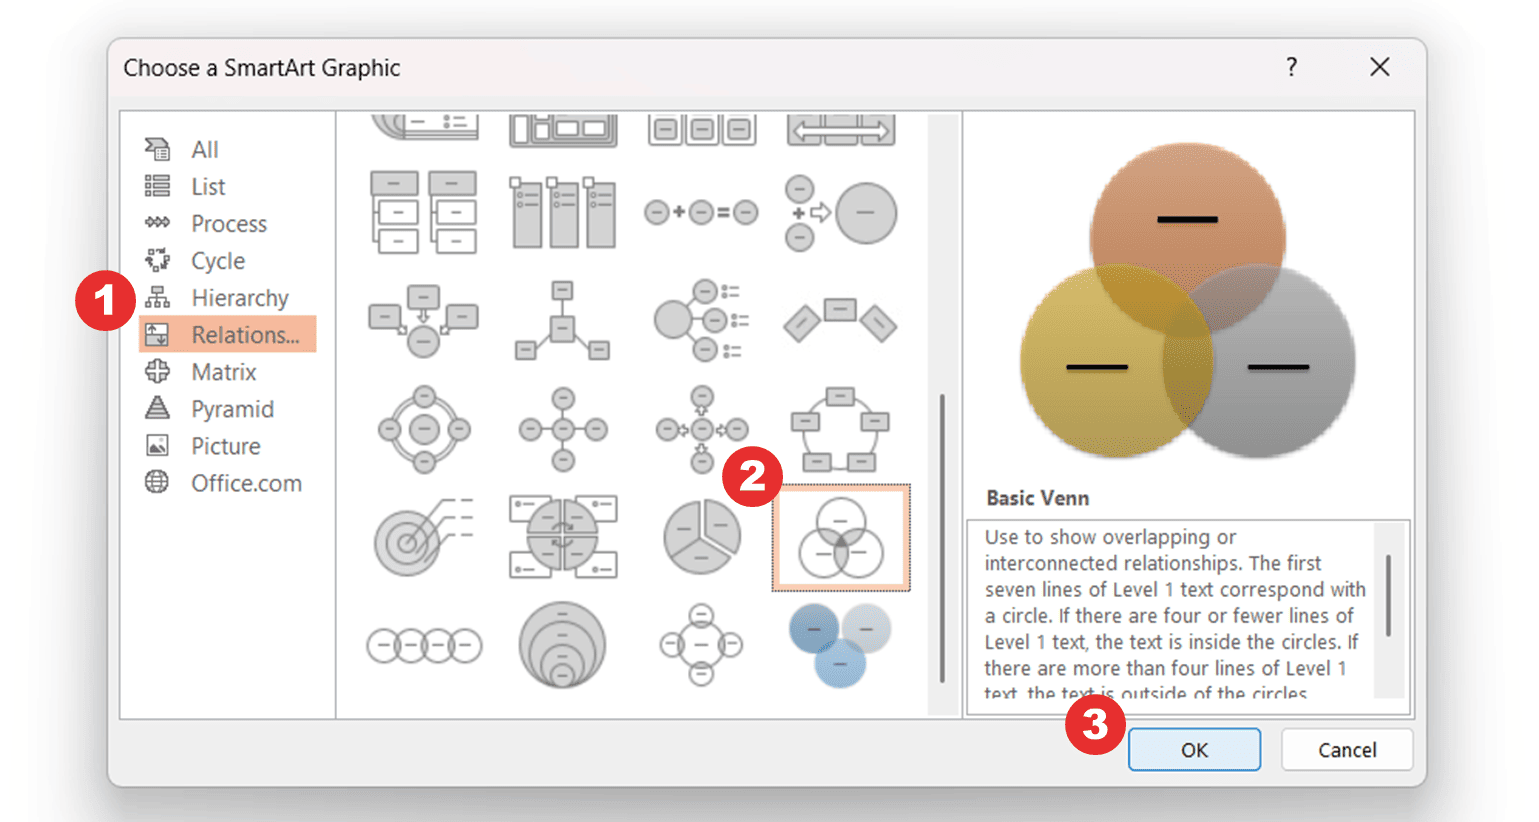
- Select the Relationship option from the left category list.
- Scroll down, select the Basic Venn template, and click OK.
Populating Your Data Fields
This default selection instantly drops a standard 3-circle Venn diagram onto your active workspace. To customize your three circle venn diagram, you can manage text inputs using two direct options:
- Direct Selection: Click straight into the [Text] brackets inside each shape layer to type.
- The Text Pane: Use the fly-out text bullet window on the left side to type lists sequentially.
The integrated smart art Venn diagram engine adjusts the font scales on the fly. It easily maintains structural symmetry across your Venn diagram 3 circles graphic as you write.

Formatting Capabilities and Structural Scope
While the default graphic generates three rings, you can adapt the framework to your presentation goals. The built-in toolkit includes several useful capabilities:
- 7-Set Capacity Limit: The native SmartArt layout engine supports a maximum of 7 overlapping circles. Adding more than 4 lines of level-1 text will automatically shift labels to the shape's perimeter.
- Alternative Frameworks: The library offers alternative layouts, including Linear Venn, Stacked Venn, and Radial Venn.
The only downside to this method is that SmartArt diagrams can be a bit restrictive when it comes to arranging circles and treating each part of the Venn diagram as an individual component. It might not sound like a big deal, but you’ll see the difference when we get to our second method, the pro one.
Method 2: Crafting a Custom Blank Venn Diagram Using PowerPoint Shapes
If you want a highly customized empty Venn diagram, skipping automated templates gives you total creative control. Learning how to create Venn diagram in PowerPoint with native shapes is the preferred choice for professional presentation designers.
To start building your blank Venn diagram, follow these initial setup steps:
- Open your presentation slide and head to the top Insert tab.
- Click on the Shapes tool icon to open the dropdown graphics menu.
- Select the Oval tool from the basic shapes library category.
The Professional Geometry Setup
Once the tool is active, you are ready to create the baseline layout of your graphic. Knowing how to make a Venn diagram in PowerPoint look perfectly balanced relies on a hidden hotkey trick:
- The Pro-Tip Hotkey: Always hold down the Shift key while dragging your mouse to ensure perfectly symmetric circles.
- Create the Overlap: Copy and paste the shape to make a Venn diagram in PowerPoint with your required number of sets.
- Align the Rings: Drag the circles together, using PowerPoint's smart alignment guidelines to overlap them evenly on the slide.

The Core Technique: Fragmenting the Intersections
Wondering how to create a Venn diagram on PowerPoint that allows individual editing of overlapping segments? This critical phase separates basic slide designs from professional, high-end presentation assets:
- Left-click and drag your mouse across the workspace to highlight all overlapping circles simultaneously.
- Look up at the top ribbon menu and click into the active Shape Format tab.
- Locate and click the Merge Shapes tool icon dropdown menu.
- Select the Fragment command to break intersections into completely standalone, editable shape layers.

[Select Shapes] ➔ [Shape Format] ➔ [Merge Shapes] ➔ [Fragment]
Styling Steps for High Data Visibility
Fragmenting splits the shared overlapping fields into independent, customizable components. From here, concluding how to make a Venn diagram in PPT decks pop comes down to applying a clean design style:
- Apply Individual Colors: Select a fragmented segment, click Shape Fill, and change colors to give intersections a unique look.
- Strip Outer Borders: Select the entire Venn graphic, click Shape Outline, and choose No Outline to keep the visual clean.
- Adjust Shading Opacity: Right-click any shape element, select Format Object, and adjust the opacity slider to maximize the visibility of background information.

Now, you’re able to focus your audience’s attention exactly where you want it. By fragmenting the shapes, you can customize each part of your Venn diagram - just like the pros do! Check out some PowerPoint examples by the 24Slides designers.
FAQ: Mastering Venn Diagrams Across Platforms
Can I create a Venn diagram in PowerPoint Online?
Yes, you can build these graphics in your web browser, but the web version has fewer editing capabilities than the desktop application.
If you want to know how to make a Venn diagram in PowerPoint online, you have to navigate two major platform limitations:
- SmartArt Restrictions: You can insert a diagram, but you are restricted to basic, non-overlapping styles like the Linear Venn layout.
- Missing Fragment Tool: You can draw and arrange overlapping circles, but the advanced Fragment tool is entirely missing from the web interface.
To work around this web limitation, manually change your circle shapes to have a transparent fill. Then, add a distinct, colored outline so that your overlapping regions remain completely visible.
How do I insert text in the middle intersection of a Venn diagram?
The only reliable way to place clear label text precisely inside a shared intersection is to generate a standalone text box. Typing directly inside the circle shapes will often skew your text alignment.
You can apply this quick method across both the desktop software and the online browser app:
- Navigate to the top menu ribbon and click Insert.
- Select Text and click on the Text Box icon.
- Click and drag to draw the box directly over the center overlap, then type your content.
Using independent text boxes gives you complete freedom of movement. It allows you to perfectly center your intersection data without breaking your main shape configurations or circle alignments.
Best Practices for Designing Effective Venn Diagrams
When you create a Venn diagram for a professional presentation, clean design choices make a massive difference. Highly optimized Venn diagrams combine mathematical logic with sharp corporate aesthetics.
Following a few strategic principles ensures your graphics remain impactful, clear, and easy for any audience to digest instantly.
Core Design Principles for Presentation Decks
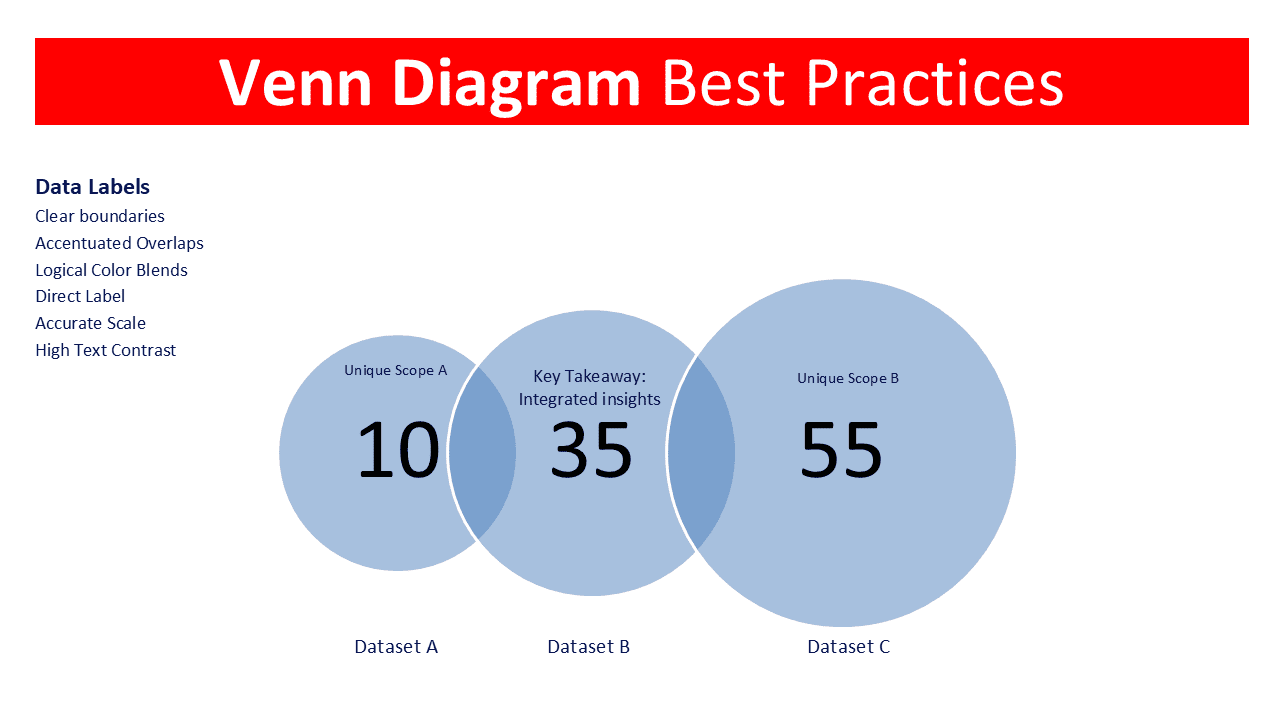
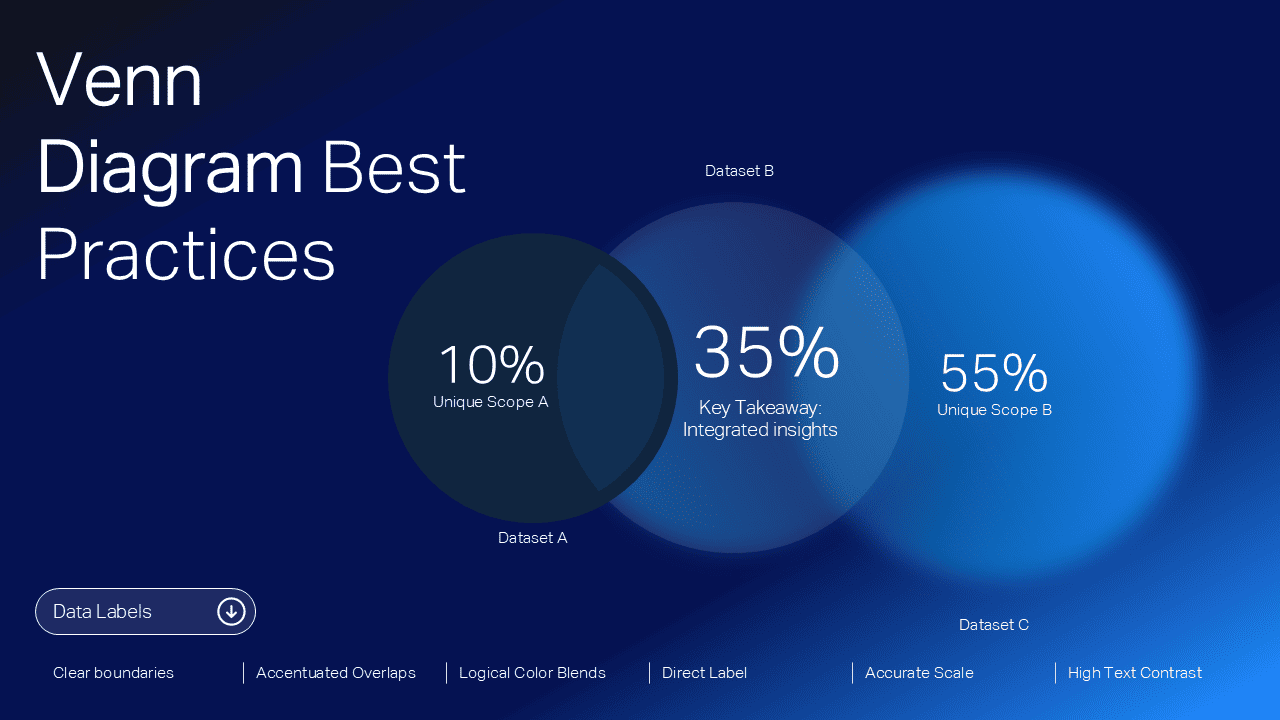
- Keep Boundaries Distinct: Clearly define the unique scope of each category circle. Setting explicit parameters prevents your audience from confusing unrelated data sets.
- Accentuate the Overlaps: Design the intersections to stand out visually. The overlapping center is the core takeaway of your graphic, so give it your primary focus.
- Use Logical Color Blends: Choose a cohesive palette where overlapping colors blend naturally. For example, a blue circle intersecting a yellow circle should create a green middle segment.
- Place Labels Directly: Drop concise text identifiers straight inside the corresponding segments. Avoid messy legends that force viewers to look back and forth across the slide.
- Reflect Scale Accurately: Adjust circle sizes to roughly match the relative weight of the data. Larger datasets or higher frequencies should visually occupy more space.
- Optimize Text Contrast: Maintain a high-contrast layout between your typography and the background shape fills. This ensures the slide remains perfectly readable from the back of the room.
Free PowerPoint Venn Diagram Templates
Want to have your Venn diagrams even FASTER? Another great option is to use templates. Check out our Templates by 24Slides platform for hundreds of free Venn diagram examples PowerPoint templates. This time, I’ll demonstrate using our Playful Venn diagram template.
Once you download it, open your template on PowerPoint and look for the Venn diagram that best fits your needs. You’ll find Venn diagrams with 2 circles, 4 circles, in a 3D style, and more.
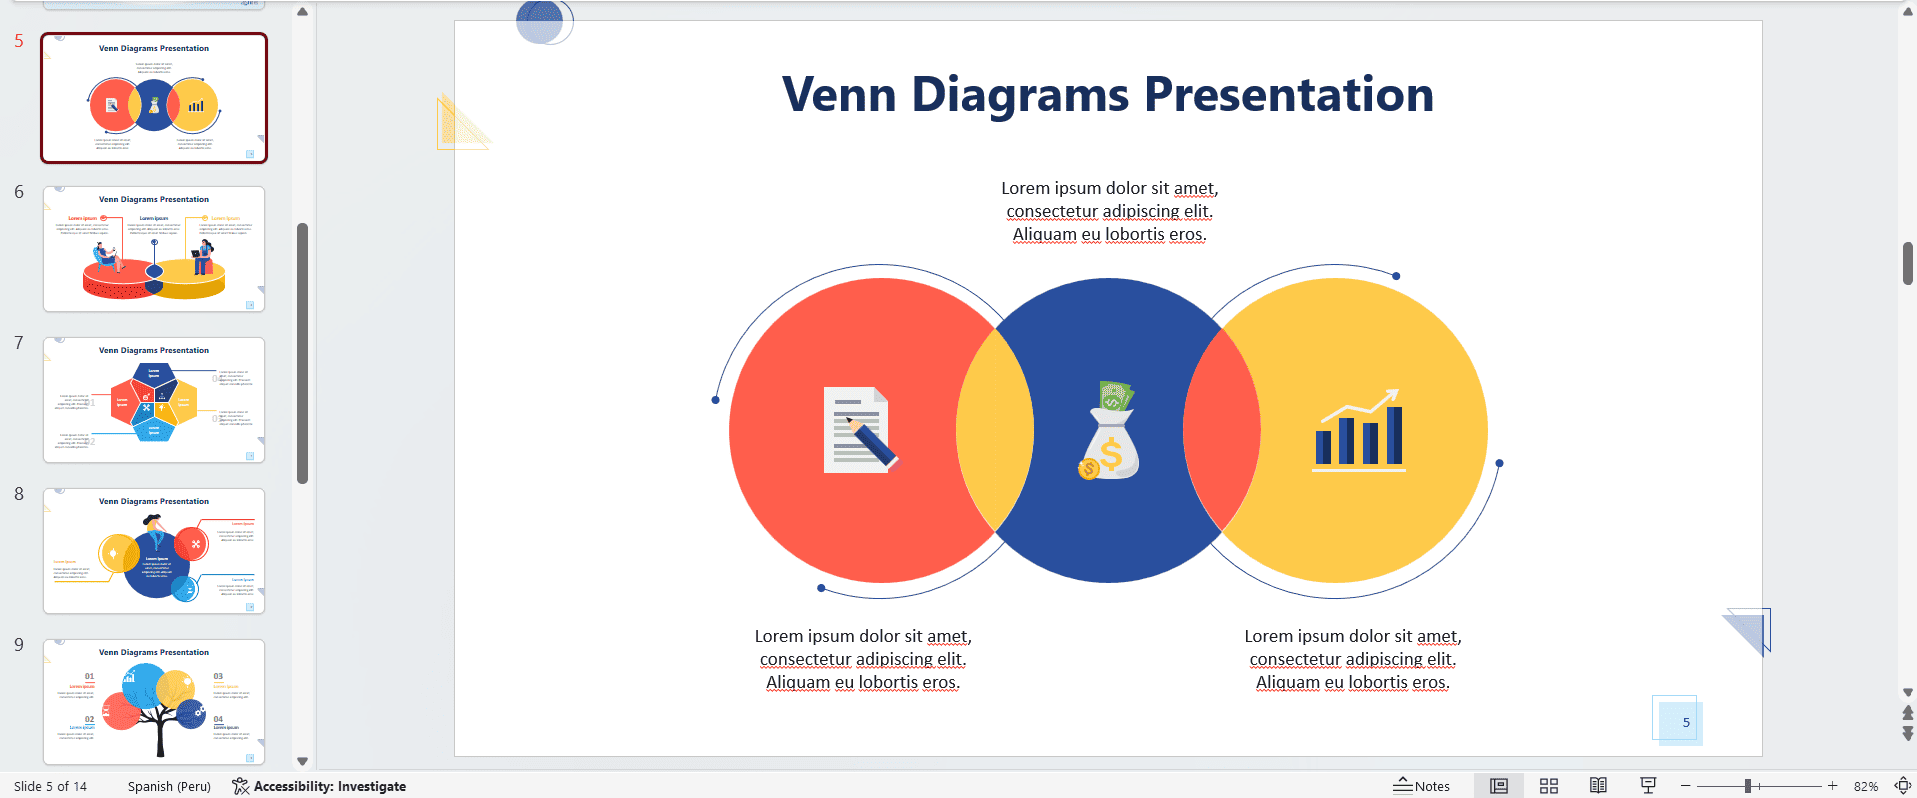
In the thumbnail pane, select the slide you want and press Ctrl+C (copy). Then, go to your presentation and left-click to paste it. Choose a Paste option: “Keep Source Formatting” keeps the original look, while “Use Destination Theme” blends it with your presentation’s style.
And that’s it! You have a polished PowerPoint Venn diagram in your presentation.
Transform your slides into masterpieces with 24Slides
Building a presentation completely from scratch takes hours you simply do not have. While finding a reliable Venn diagram template for PowerPoint can rescue a tight deadline, a generic layout rarely matches the exact aesthetic of a high-stakes executive pitch. If you want your presentation assets to look truly bespoke, you need a solution tailored explicitly to your brand identity.
That is where 24Slides comes in. For over 12 years, our global team of more than 200 professional presentation designers has specialized in turning raw data and rough concepts into premium, boardroom-ready slides. Whether you need a highly technical multi-set schematic or a complete corporate overhaul, we build your assets with absolute precision.

Why Global Brands Trust 24Slides
- Over a Decade of Excellence: 12+ years of dedicated presentation design experience across every major industry sector.
- Round-the-Clock Scale: A powerhouse team of 200+ design specialists working to meet your tightest corporate timelines.
- Flawless PowerPoint Integration: Every slide we build is fully editable, making it easy to tweak data points on the fly.
Instead of spending your evening trying to customize a basic Venn diagram for a PowerPoint template, let our professional design team handle the heavy lifting.
Take advantage of our exclusive introductory offer: send us your toughest slide, and we will transform it into a completely custom, brand-tailored masterpiece for just $1

Want to enhance your PowerPoint skills? Explore this content!
- PowerPoint Charts, Graphs, & Tables Made Easy | Tips & Tricks
- Mastering the Art of Presenting Data in PowerPoint
- PowerPoint 101: The Ultimate Guide for Beginners
- How to Create a Pie Chart in PowerPoint (+Free Templates)
- How to Make a Timeline in PowerPoint? Step by step
- How to Remove Background From Image in PowerPoint (Step-by-Step Guide)
- How to Use PowerPoint Speaker Coach for Flawless Presentations