How to Create a Flowchart in PowerPoint (+ Free Templates)

PowerPoint flowcharts are a great way to simplify complex information and engage your audience. They visually capture ideas or processes, making them a powerful tool for your PowerPoint presentations!
In this post, I’ll provide a step-by-step guide to creating a flowchart in PowerPoint. We’ll explore your options, from creating one from scratch to using PowerPoint’s SmartArt tool.
For those who love visuals, I'll also include screenshots and gif examples along the way. And don't forget to download our awesome free templates at the end!
So, keep reading to learn how to create the perfect flowchart for your PowerPoint presentation!

Here are the topics we'll cover:
- What is a Flowchart?
- How to Create a Flowchart in PowerPoint
- How to Edit a PowerPoint Flowchart
- Free PowerPoint Flowchart Templates
- Make your presentations more impactful with 24Slides
What is a Flowchart?
A flowchart is a diagram that shows the passing from one step to the next. It enhances data visualization by helping to illustrate the structure of a process or concept.
They are often used for complex tasks, especially in process and project management. However, flowcharts can be used for pretty much anything that requires following steps in chronological order.
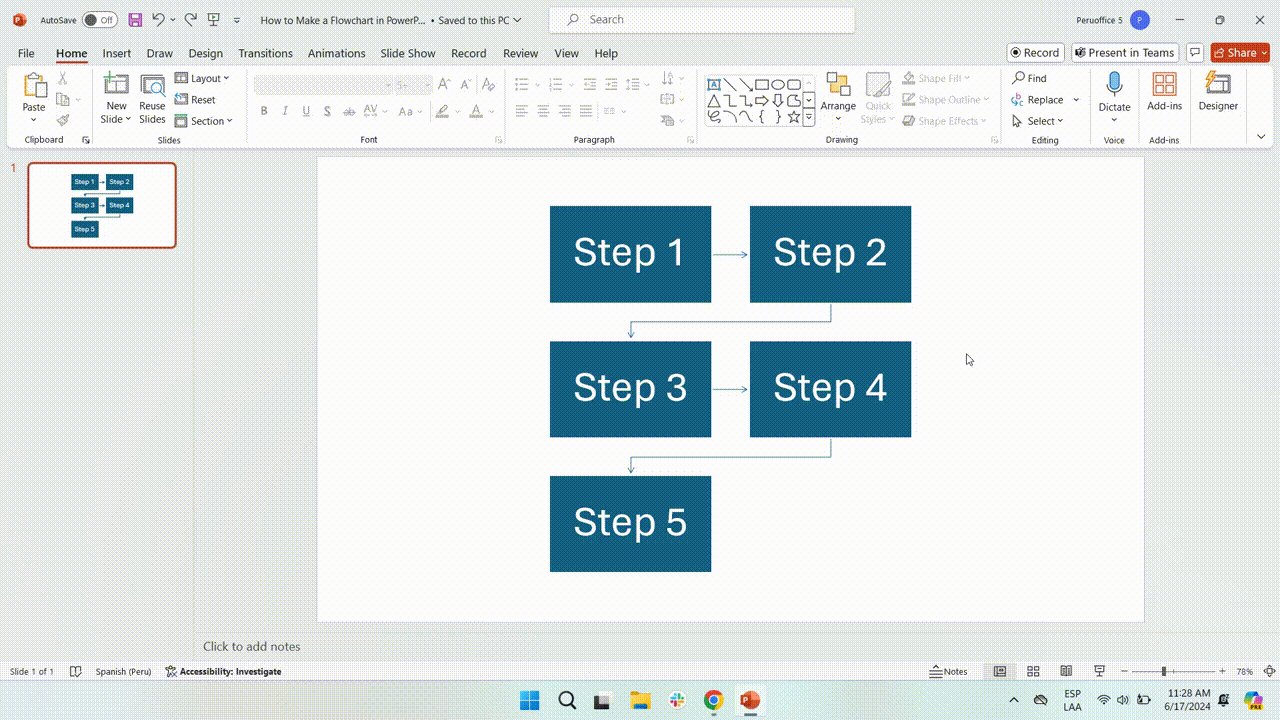
Imagine you're planning how your team deals with the customer journey. A flowchart outlines each step, from receiving the order to delivering it. This ensures consistency and improves efficiency for everyone involved.
Here’s an example:

You can create informative and visually appealing professional flowcharts in PowerPoint. All you need to do is continue reading. After all, knowing how to use charts effectively can make all the difference.
How to Create a Flowchart in PowerPoint
To make a flowchart in PowerPoint, you have two main options: start from scratch with shapes and arrows or use the SmartArt tool.
Create a flowchart using the SmartArt tool
This is the easiest way to create a flowchart in PowerPoint. The SmartArt tool allows you to insert a pre-made flowchart into your slides and customize it.
- Step 1: Go to the Insert tab and select the SmartArt option. This will open the SmartArt Graphic pop-up window.
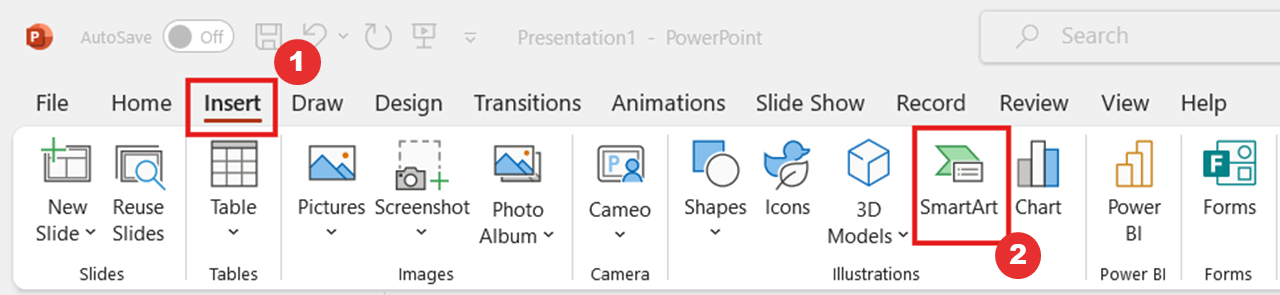
- Step 2: Go to the Process option to get flowchart options. Here, you’ll get options like Staggered Process, Gear, and Circular Bending Process. There are many options for you to choose from!
You can also check out the Cycle option for circular or repeating processes.
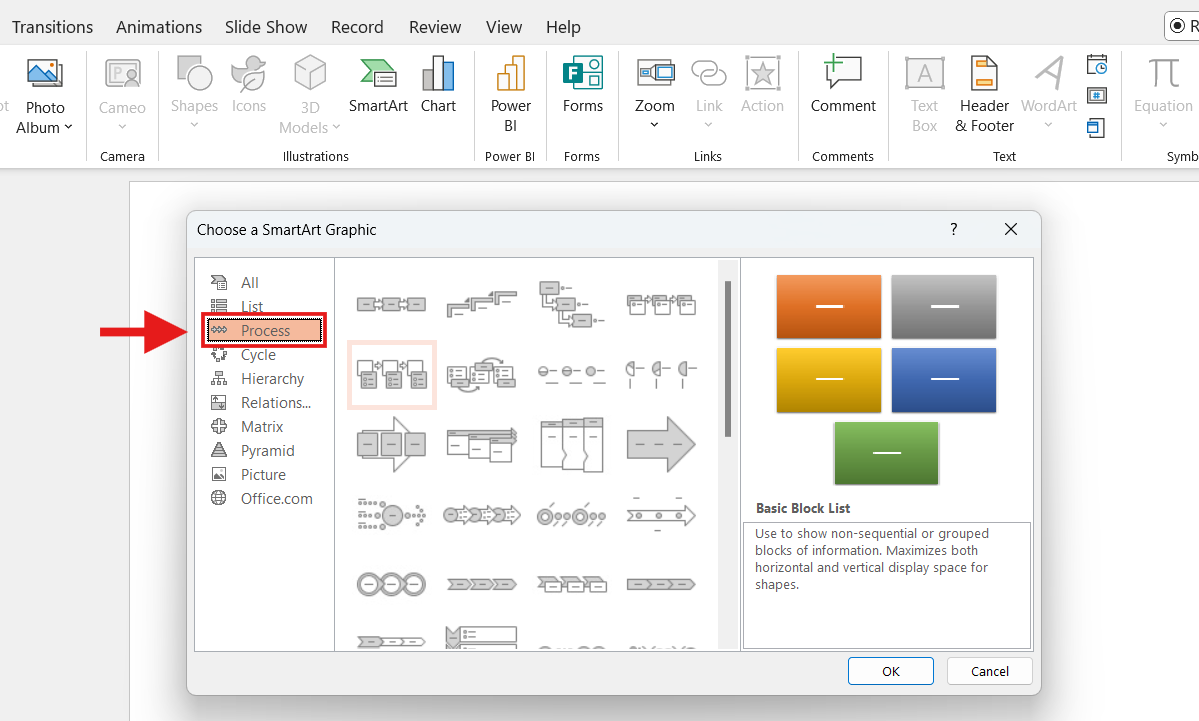
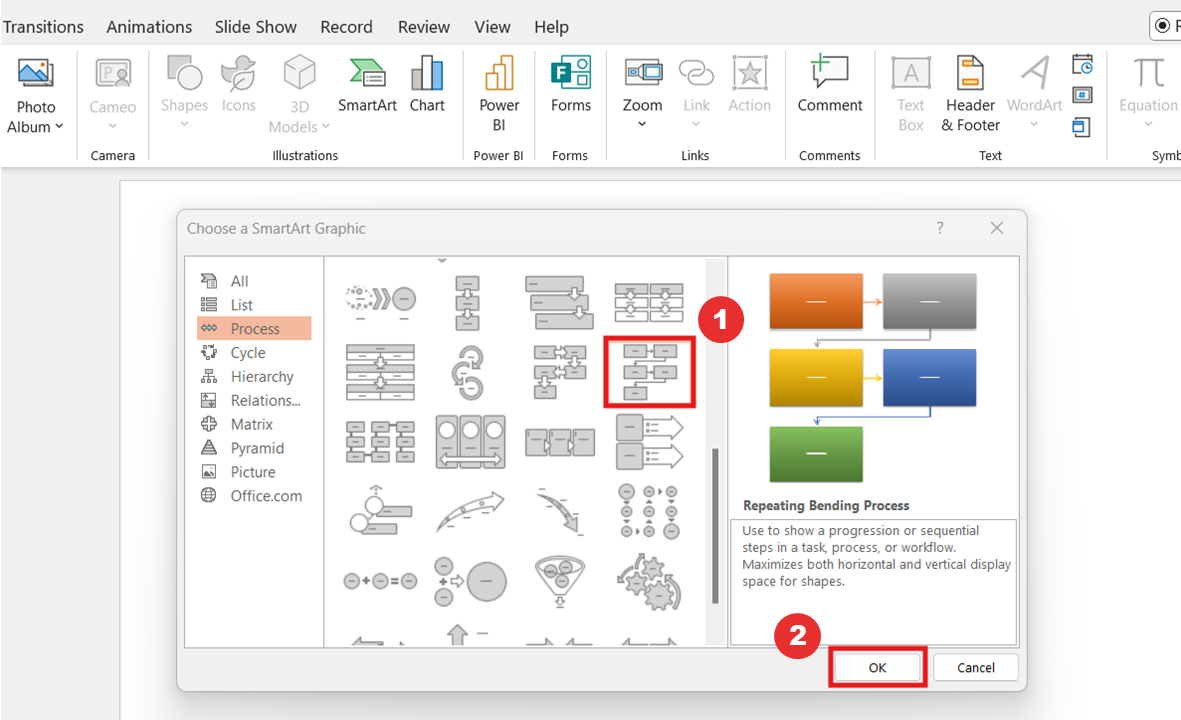
- Step 3: Select your flowchart. Once you click on any options, you’ll get a diagram preview on the right side of the window, plus a small description.
Go through all you need until you find one that fits your needs!
- Step 4: Once you have picked one, click on it to see the graph preview. Then, click OK to insert it into your slides.
- Step 5: Add your content. You can type it in by clicking on the text you want to replace or use the Text Pane option to write it in a bullet list format. It will immediately transfer your text into the flowchart!
- Step 6: Edit your SmartArt flowchart. You can use the anchor points to adjust the overall size of the flowchart or select specific shapes to edit individually.
Once you click on the chart, you'll see the SmartArt tab, where you'll find more options to edit your flowchart. For example, you can use the Change Colors option or the SmartArt Styles to add shadows and depth to the shapes.
Want to go further? Below, you'll find more options to edit and customize your PowerPoint flowchart!
Create a flowchart from scratch
Earlier, I said using the SmartArt tool is the easiest way to create a flowchart. So why make one from scratch? That’s simple: Creating a flowchart from scratch allows you to design it just as you want.
This is the best option for those who need a custom or very specific flowchart design.
Pro tip: “Sketching simplifies the process if you make a flowchart from scratch. This can help better organize the content within the space.” Carmen Navarrete/ Expert Designer
For this example, we will create a classic flowchart of processes and decision-making.
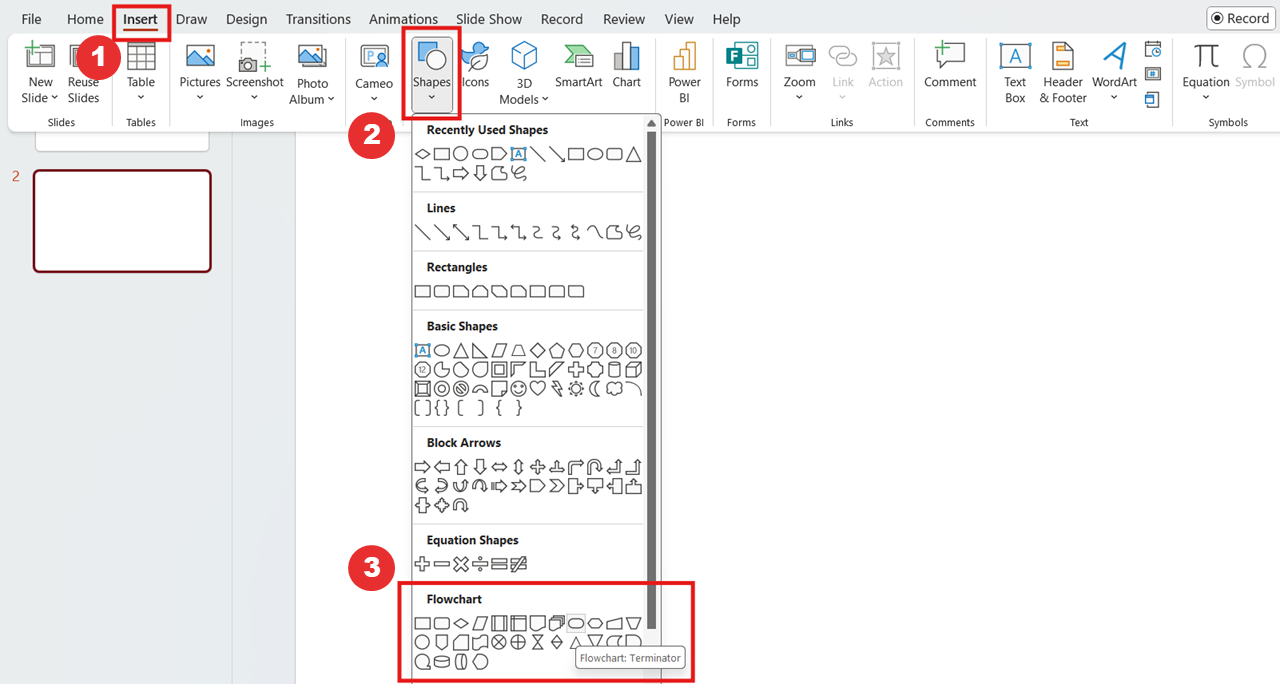
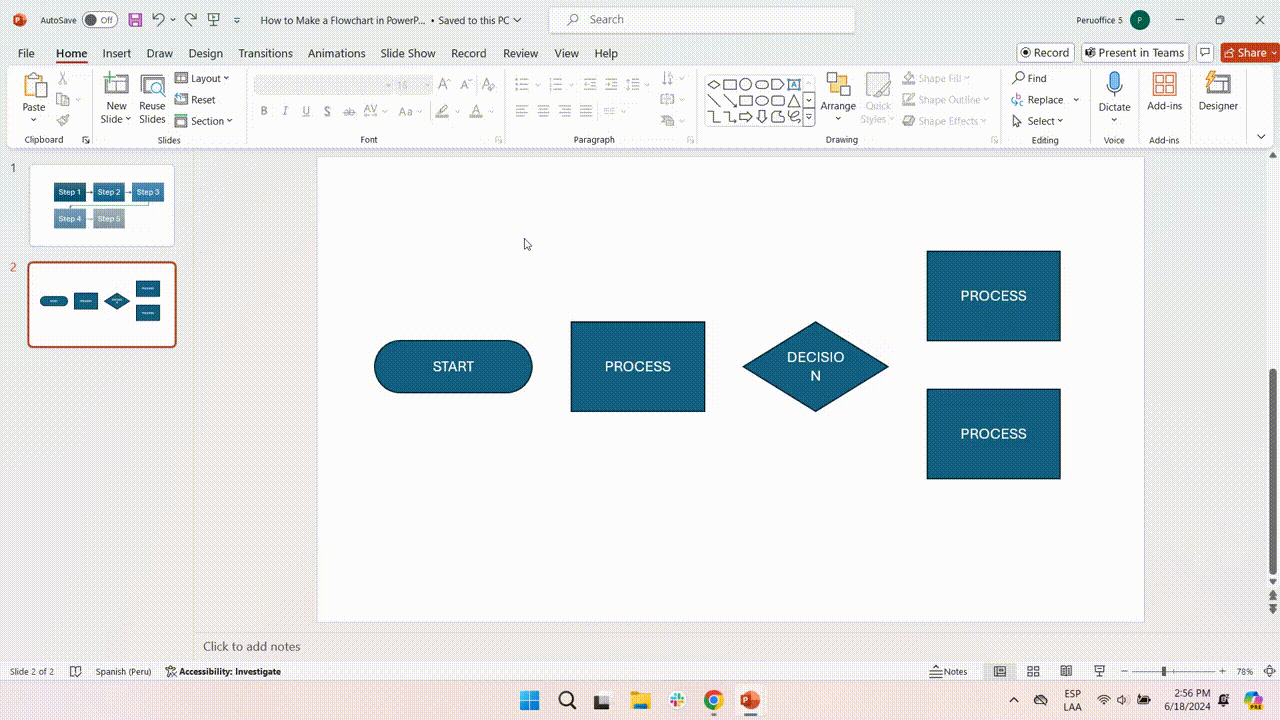
- Step 1: Go to the Insert tab, click Shapes, and choose an oval from the Flowchart section.
Keep in mind that each type of shape has a different meaning. Luckily, a short description will appear when you move the mouse over each option. In this case, we will use the following shapes:
An oval represents the beginning or end of a process.
A rectangle represents a process and is used for the main steps.
A diamond is used at decision points in the process.
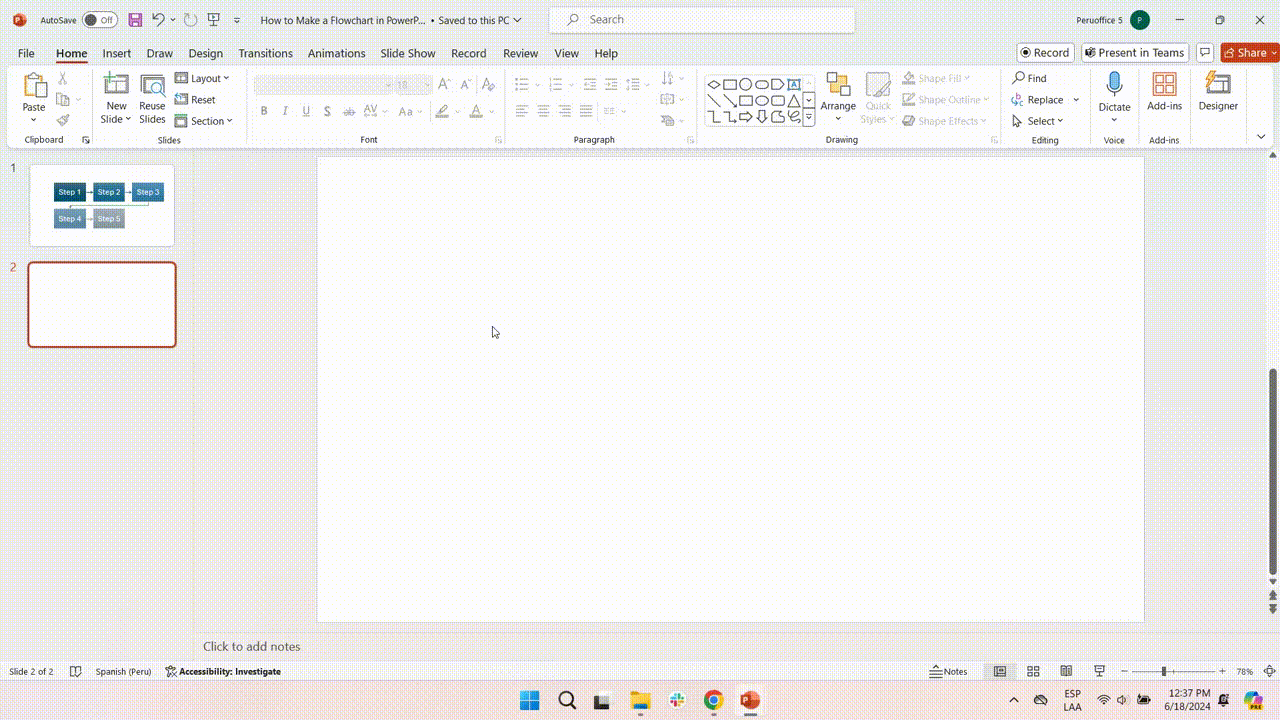
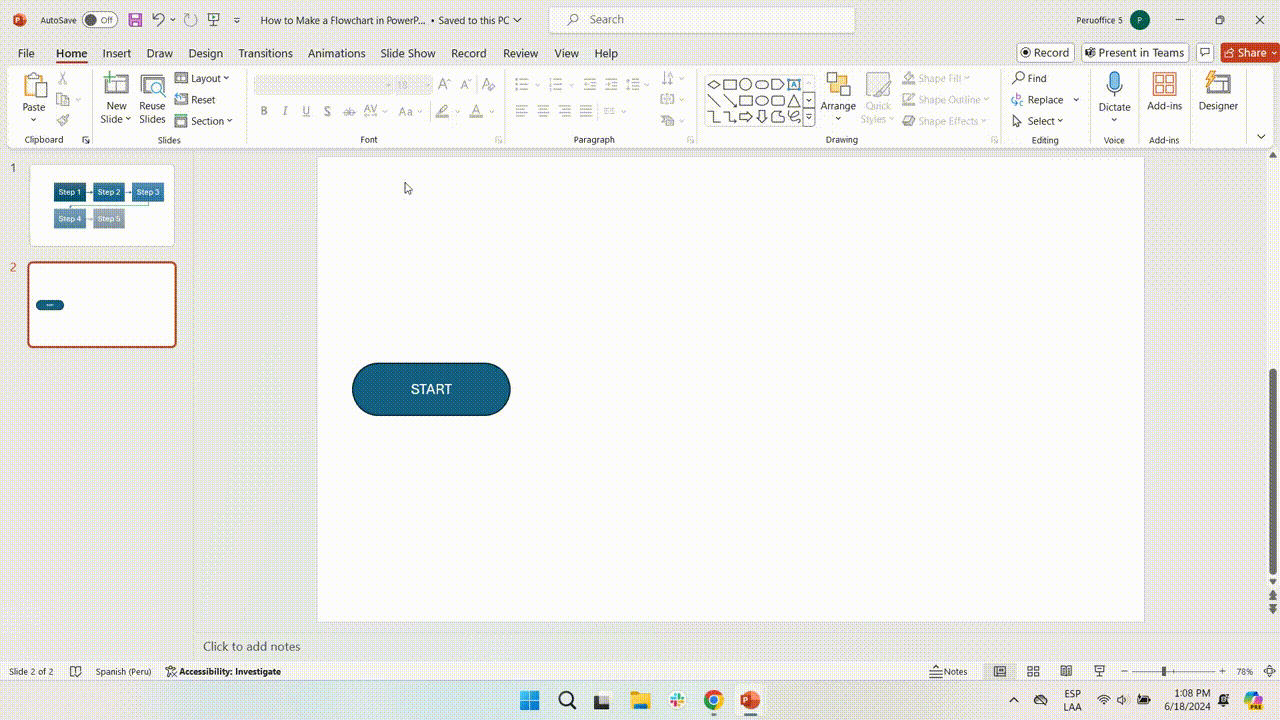
- Step 2: Pick an oval and double-click it to insert it into your slide. Type in your content to add it automatically to the shape.
If you want to resize the shape, hold Shift to maintain its proportions.
- Step 3: Keep adding all the necessary shapes and typing in the content. The best thing about creating a flowchart from scratch is that you can mix and match different shapes according to your needs.
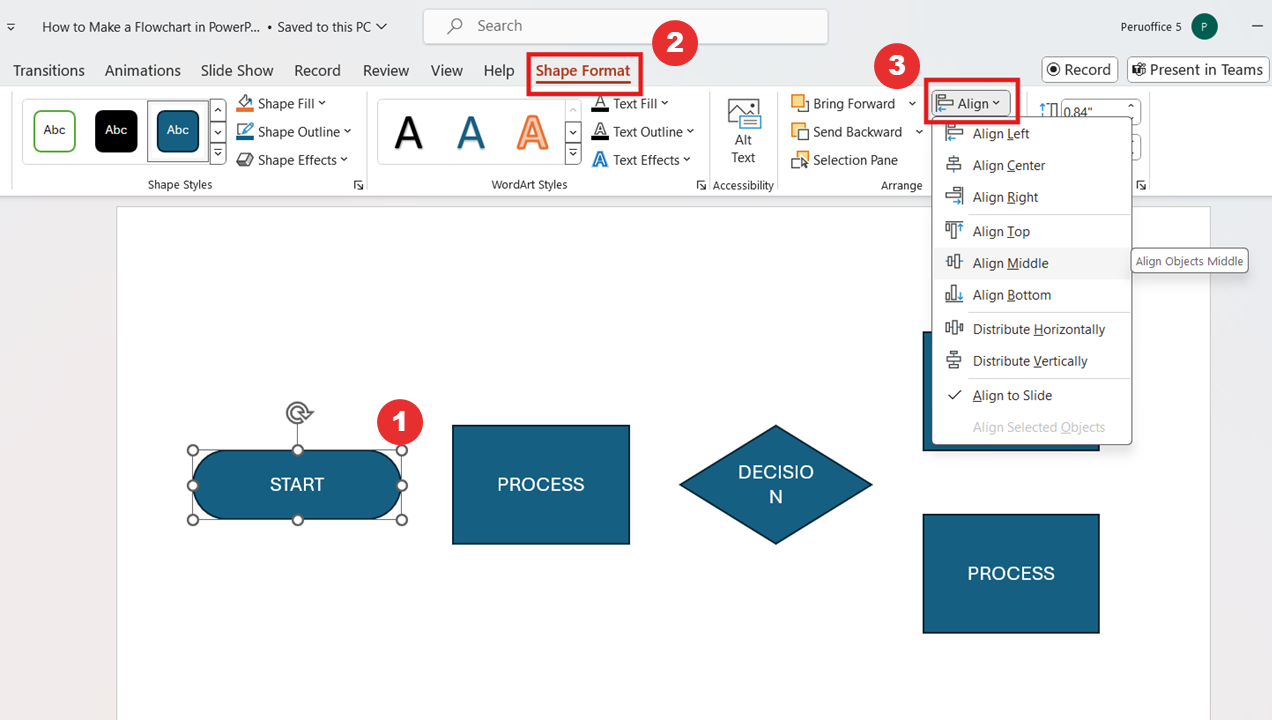
- Step 4: Arrange the shapes correctly to create your flowchart. You can drag and drop any shape by clicking on it to select it and then moving it around.
You can also organize your shapes using the Align option. This will give you options like Distribute Horizontally or Distribute Vertically to ensure your shapes are equally spaced.
Click on one or more shapes, navigate to the Shape Format tab, and choose the Align option.
- Step 5: Add the connecting lines to your flowchart. Go to the Insert tab >Shapes and pick a line to start drawing.
Hover your mouse over any shape, and you’ll get anchor points from where to begin drawing your arrow. Drag it all the way to another shape, and you’ll get new anchor points to where your arrow will end.
Do this as many times as you need to create all the connections in your flowchart.
- Step 6: Edit your flowchart. You can change the colors of each shape, customize the lines around them, change the font, and even choose design styles for the arrows.
Make sure your presentation has a unified style and ensure brand consistency. This can make all the difference in making it look more polished and put together.

The possibilities are endless from here. Be creative and have fun!
In the next section, you’ll find more options for editing and customizing the design of your PowerPoint flowchart!
How to Edit a PowerPoint Flowchart
Once you’ve got the overall structure of your flowchart, it’s very easy to edit it. You can use PowerPoint tools to edit flowcharts made with SmartArt, created from scratch, or imported from other presentations.
Here are the main options to customize your PowerPoint flowchart:
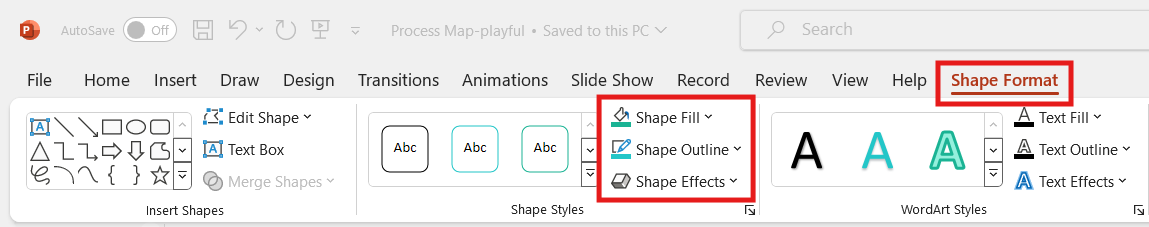
Selecting any shape will enable the “Shape Format” tab. This tab offers extra customization options to make your flowchart look exactly as you want.
- “Shape Fill” allows you to change the color and texture of the shape.
- “Shape Outline” lets you change the color, the style (sketched, dashed, dotted), and the width of the line.
- “Shape Effect” allows you to give depth and shadows to the shape.
- For arrows and lines, you have the same options described above in the Shape Outline option.
To make your presentation even better, follow these tips:
- A consistent design style and color theme will make your presentation look more professional and clean. You can find previously used colors in the color menu or use the Eyedropper tool to match your color scheme.
- Adding icons can make your PowerPoint flowchart easier to understand at first glance and more memorable for your audience.
- You can also add animations to your flowchart design to make it appear step by step or to make your slide more impactful. Just be careful not to go overboard with them!
This will definitely help you create the perfect flowchart for your PowerPoint presentation!
Free PowerPoint Flowchart Templates
Maybe you don’t need to create a flowchart in PowerPoint from scratch. Hundreds of free templates are available that you can use and add to your presentations.
Once you find the perfect flowchart, adding it is simple! In the thumbnail section on the left side of the screen, right-click the flowchart slide and pick Copy.
Then, go to your presentation’s thumbnail and right-click on it. Choose a Paste option: “Keep Source Formatting” keeps the original look, while “Use Destination Theme” blends it with your presentation’s style.
And you’re all done! You’ve now got a flowchart in your PowerPoint presentation.
The best part is you don't have to spend time looking. Check out our Templates by 24Slides platform for hundreds of free PowerPoint flowchart templates.
In a few clicks, you will get a professional design. Have fun with them!

Make your presentations more impactful with 24Slides
We’ve already reviewed how to create and customize a flowchart in PowerPoint. However, if all this seems like too much work, why don’t let professionals do it?
With 10+ years of experience and more than 200 designers worldwide, we are the world’s largest presentation design company across the globe.
Let 24Slides take care of the visuals while you concentrate on creating awesome content!
Not only will you get a stunning presentation, but you'll also receive one that truly reflects and enhances your brand.
The best of all is that you can try us for just $1. That's right – we'll design a unique, editable one-slide presentation that reflects your brand for just a single dollar!

Want to enhance your PowerPoint skills? Explore this content!