How to Make a Bar Chart in PowerPoint (Step-by-Step Guide)

Looking to make your data stand out? In this article, you'll learn how to quickly create a bar chart in PowerPoint to enhance your presentations.
A bar chart is a simple yet powerful way to visualize data side by side. Whether you're presenting sales or performance metrics, it helps improve clarity and impact.
In this step-by-step guide, I’ll show you how to insert and customize a bar chart in just minutes. By the end, you’ll have a polished chart that keeps your audience engaged and reinforces your message.
Let’s get started!

Here are the topics we'll cover:
- How to create a bar chart in PowerPoint
- How do I edit a bar chart in PowerPoint?
- Free PowerPoint Bar Chart Templates
- Frequently Asked Questions
- Take your presentations to the next level with 24Slides
How to create a bar chart in PowerPoint
Here’s how to make a bar graph in PowerPoint in just 4 easy steps!
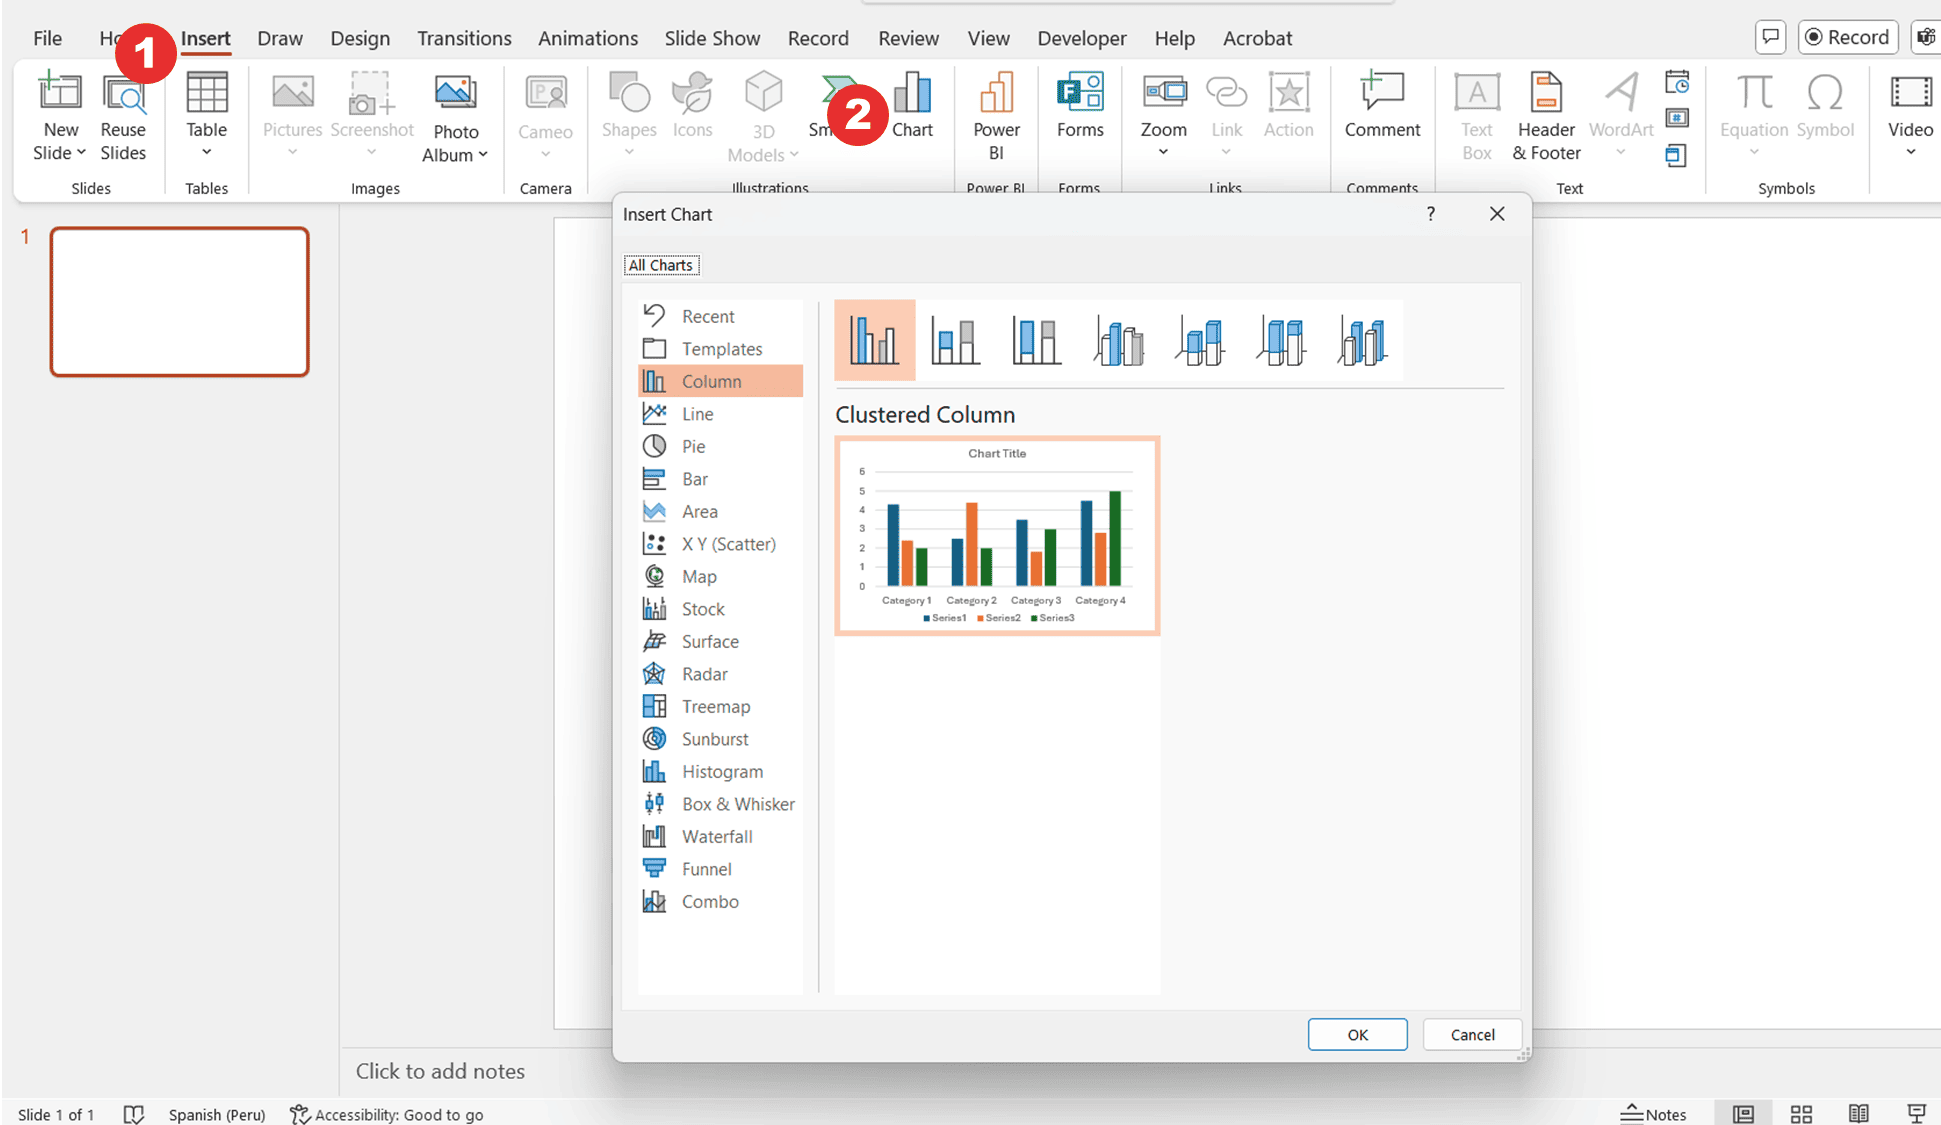
Step 1: Go to the Insert tab
- Select where you want to place your bar chart.
- Go to Insert tab > Chart. This will open the “Insert Chart” pop-up window.
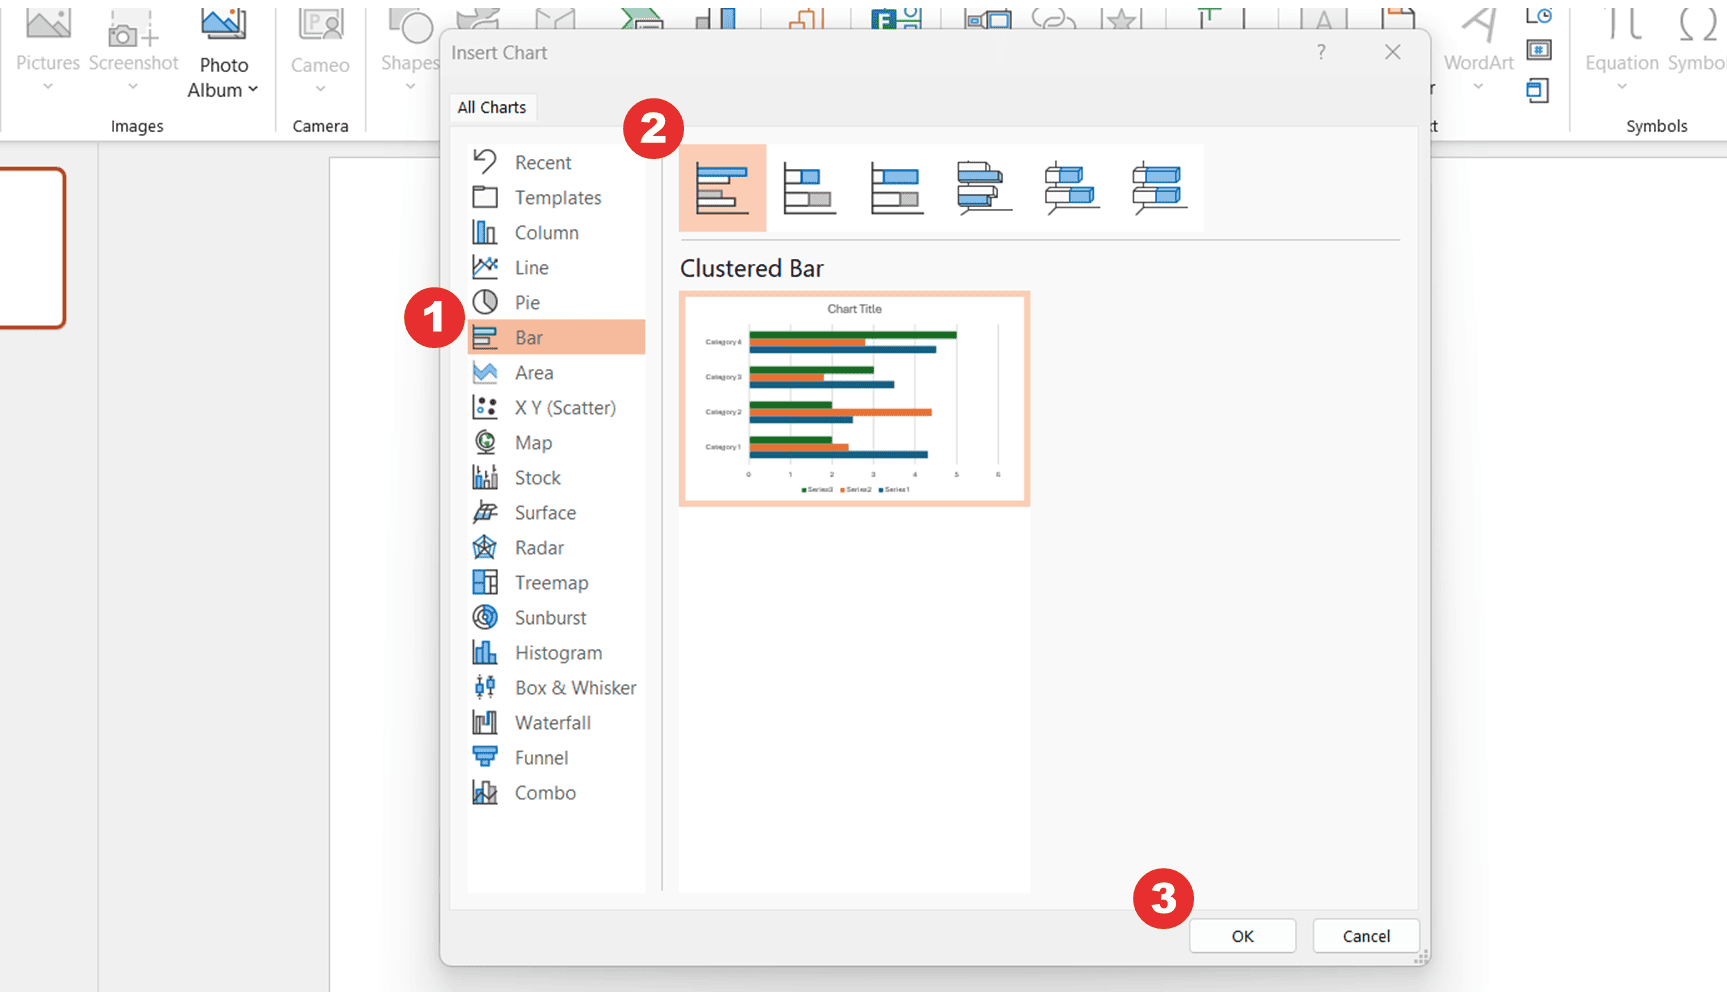
Step 2: Insert the Bar Chart
- Click on "Bar" from the list on the left.
- Then, select a bar chart style and click OK to add it to your slide.
For this example, I’ll choose the “Clustered Bar” option.
Step 3: Add and Edit Data
- Once the bar chart appears, a spreadsheet will open with default data. Input your categories and values, then close the spreadsheet when finished.
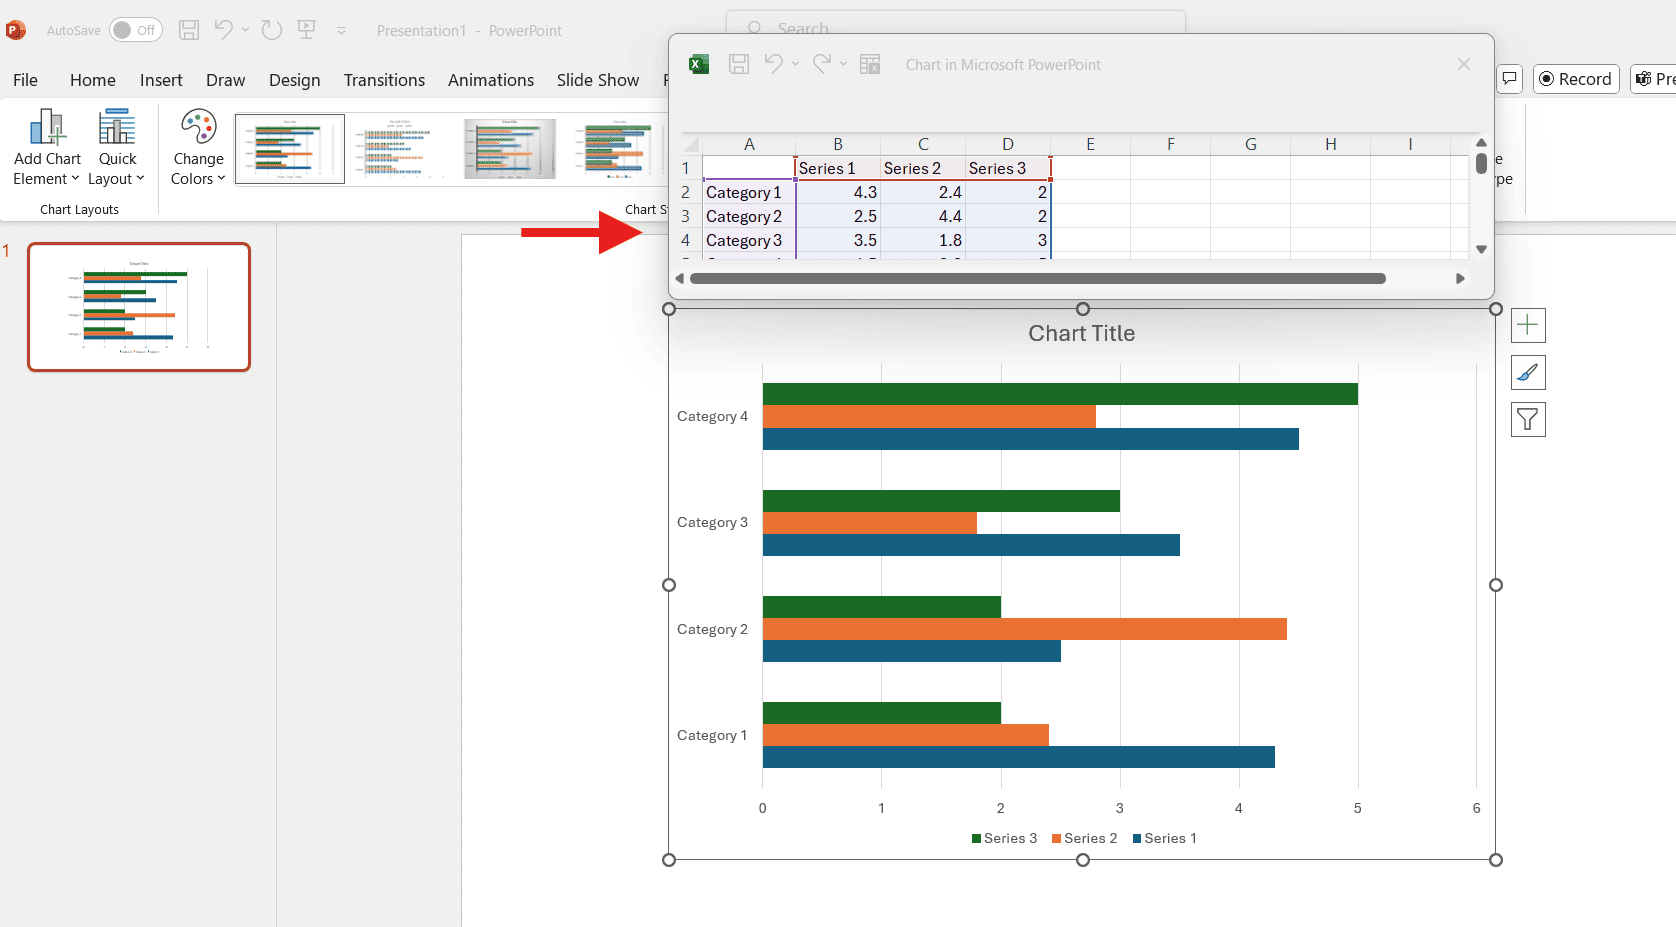
Tip: If you close the spreadsheet by mistake, right-click the chart and select “Edit Data.”
Step 4: Format your Bar Chart
- Select your bar chart and use the icons next to it to edit. Here, you can adjust the chart elements, change the style and colors, and apply filters.
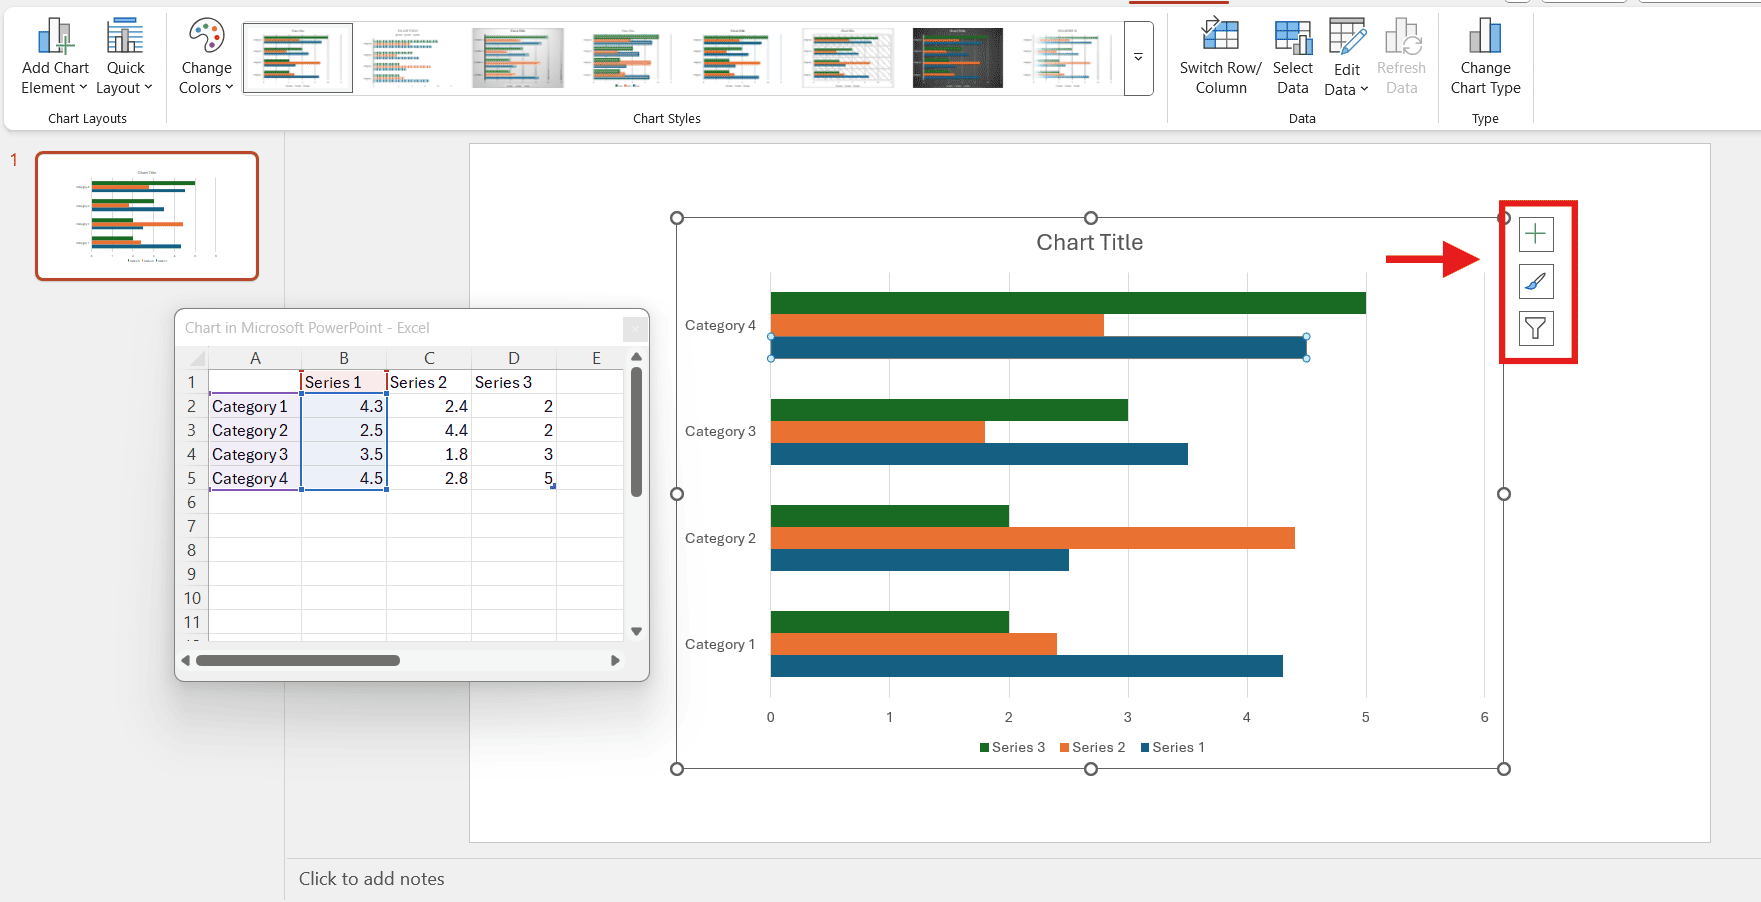
If you’re curious about how to customize a PowerPoint bar chart, we’ll review your options in the next section!
How do I edit a bar chart in PowerPoint?
To help you understand how to customize a bar chart in PowerPoint, let's use a simple, real-world example:
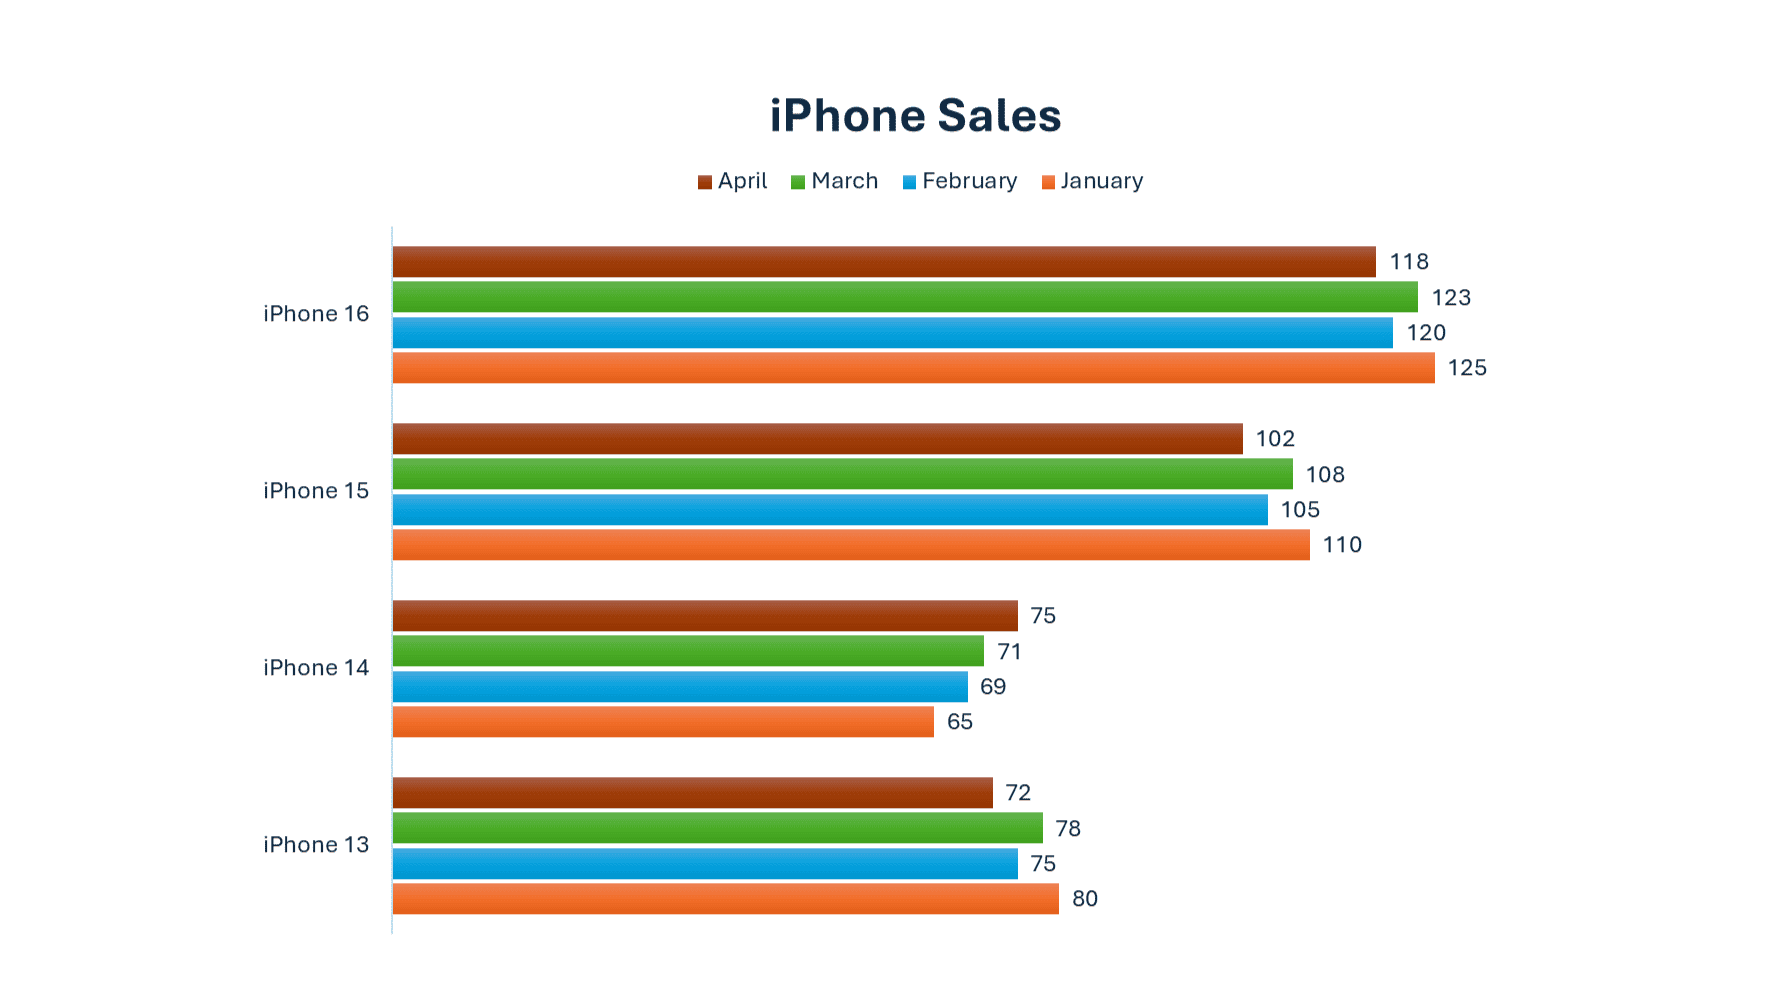
Imagine you run an electronic store and need to compare iPhone sales (units) over a few months. A bar chart can display which product has the highest and lowest sales, making it easy for your audience to understand the information.
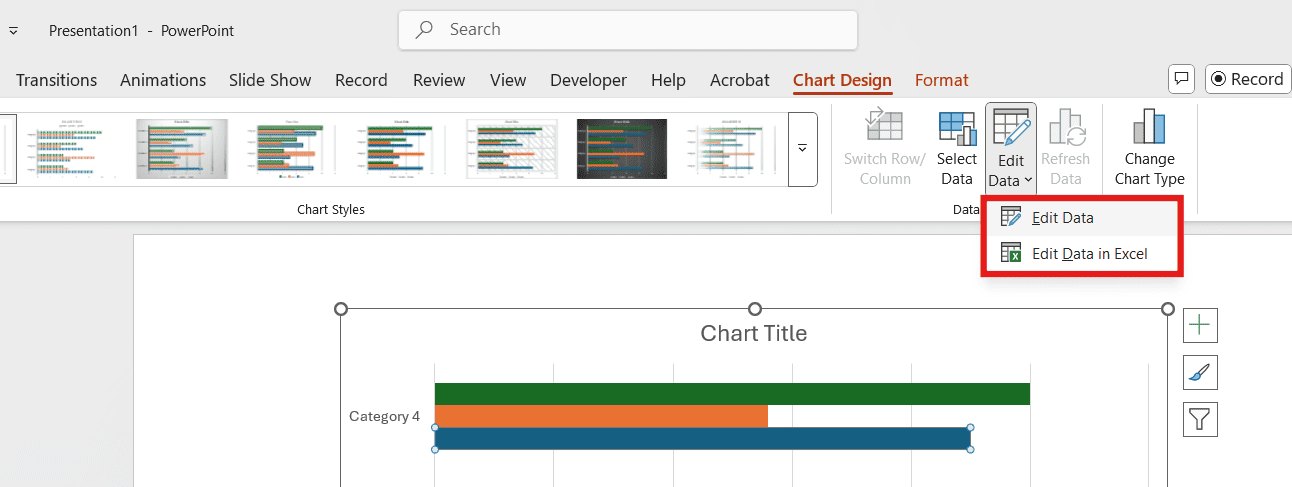
Step 1: Edit Data
- Right-click on the chart and select Edit Data.
- An Excel sheet will open to input your data.
- Finally, close the spreadsheet.
For this example, I’ll list iPhone models in the category column and months in the series columns. Since I want to display data for four months, I'll add a data series column.
Tip: For large datasets, it's best to edit them directly in Excel for easier management and faster processing.
Step 2: Change the Chart Style
- Click the bar chart to select it.
- Go to the Chart Design tab and choose a “Chart Style.”
Step 3: Adjust the Colors
- Select your bar chart and go to Chart Design.
- Click Change Colors and pick a scheme that matches your brand.
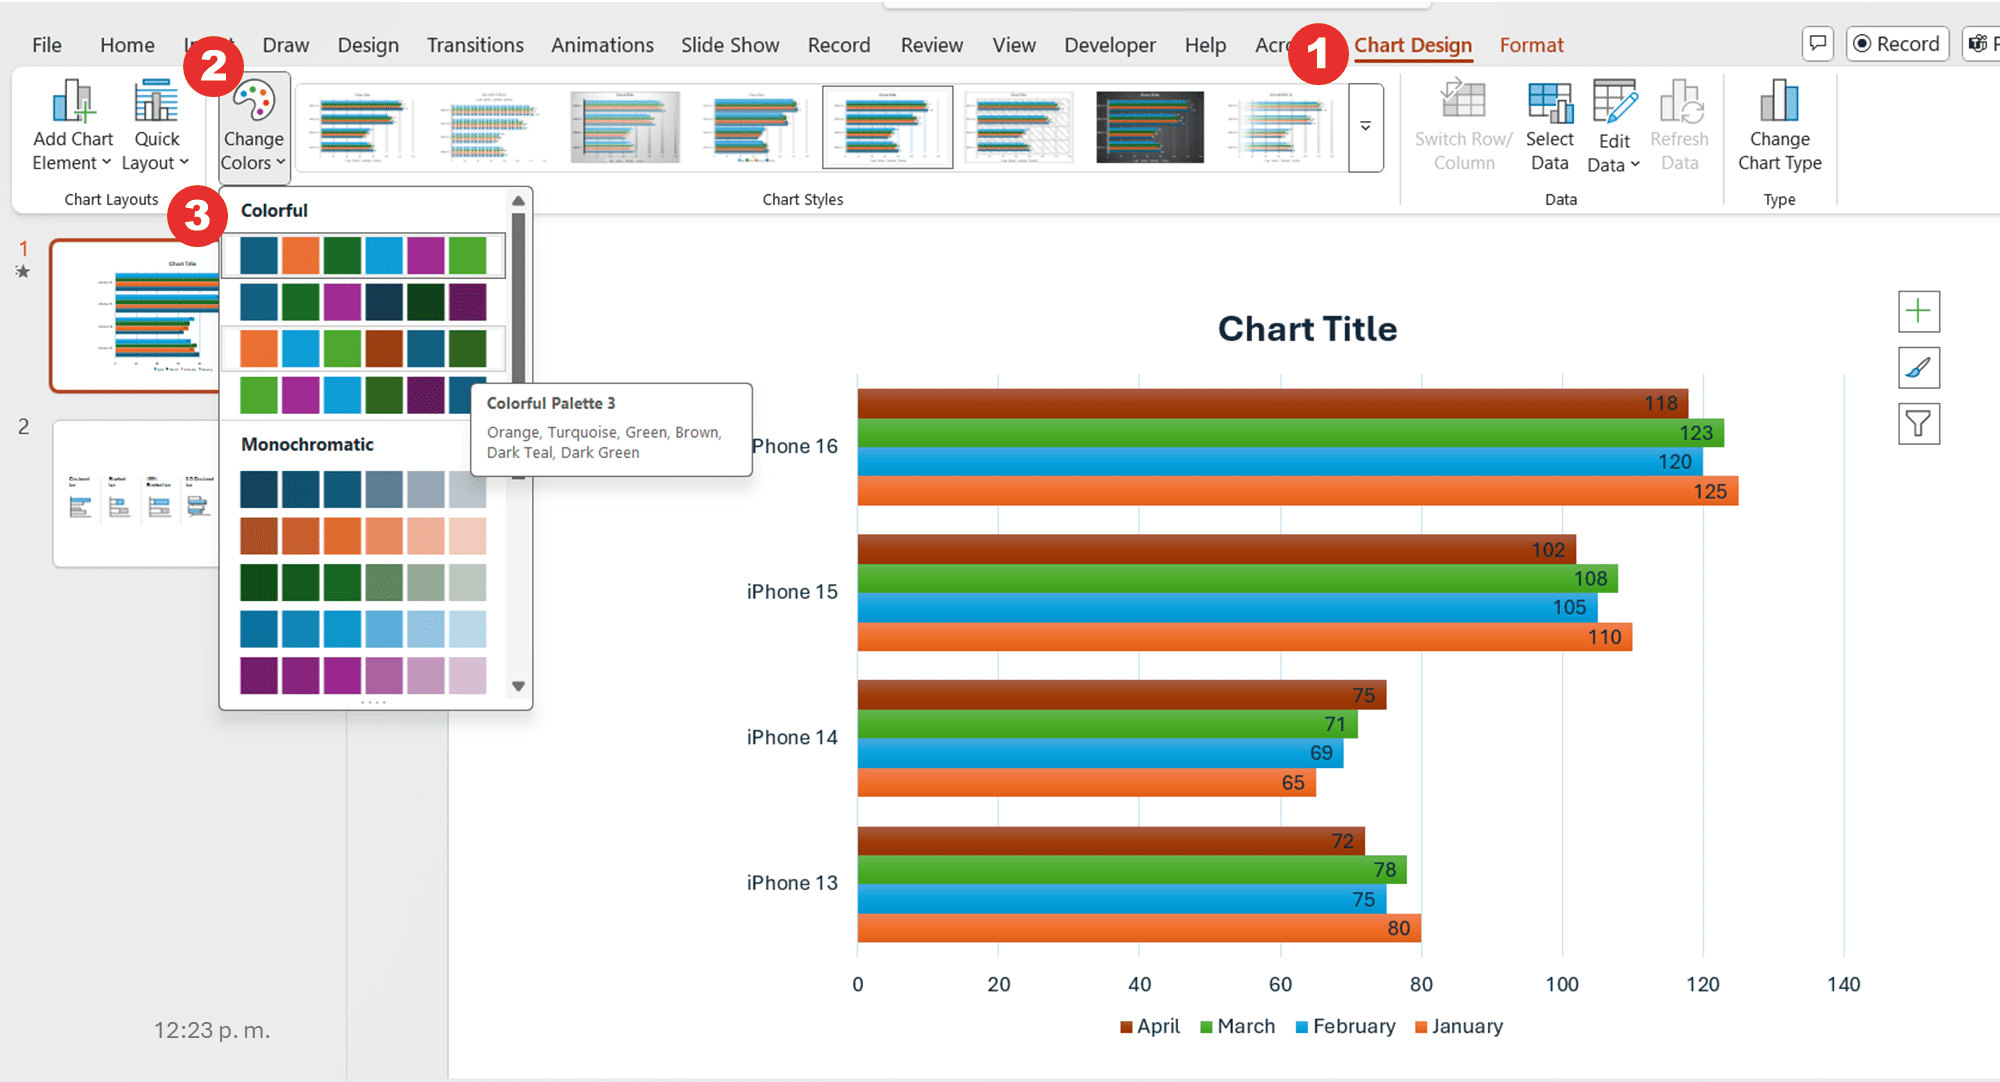
Tip: You can customize each data series individually. Right-click a bar, select Fill, and choose a color. You can also use custom colors, the eyedropper, textures, and more.
Step 4: Edit Labels and Titles
- Click any text element to edit it.
- Select your text to change the font, size, and more.
- Use the Format tab to add shape styles.
- Click the Chart Elements button ("+" icon) to add or remove elements like titles, data labels, and gridlines.
Step 5: Adjust Bar Spacing and Layout
- Right-click on any bar in the chart.
- Select “Format Data Series”.
- Use the Gap Width slider to change the space between bars.
- Adjust Series Overlap if you want bars to overlap.
Finally, review your design and make any necessary adjustments. Here’s the final result after refining it:
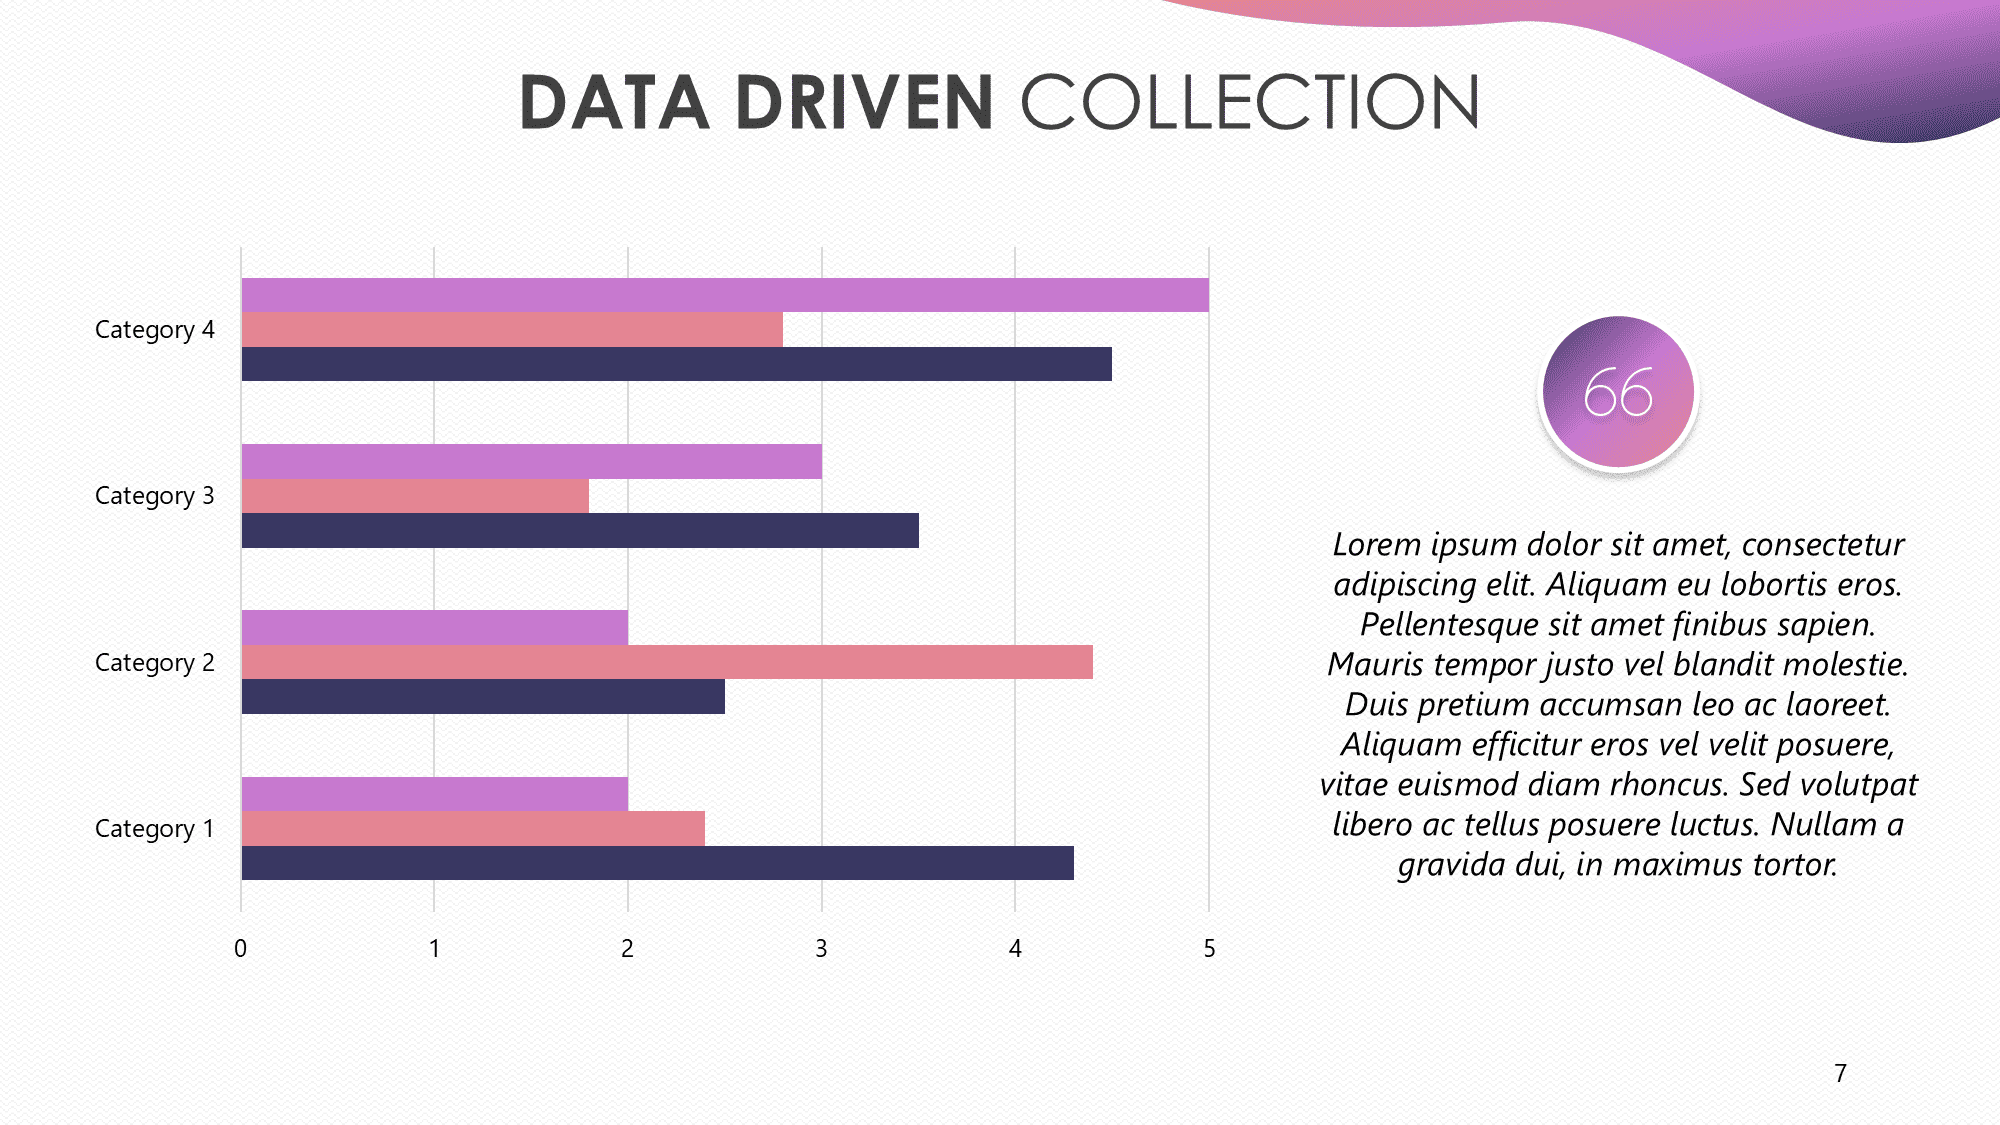
Free PowerPoint Bar Chart Templates
Bar charts are one of the most popular ways to represent data. Why? Simply put, they’re the best for comparing categories side by side. However, creating them from scratch can be time-consuming. That’s where templates come in.
Our Templates by 24Slides platform offers hundreds of free, stunning templates, including bar charts, to enhance your presentations. Simply download, input your data, and customize the colors and labels to match your brand.
Get creative and have fun customizing them!
Frequently Asked Questions
How to create a bar graph in PowerPoint?
Go to Insert > Chart > Bar. Then, pick a style and click OK.
Can I create a 3D bar chart in PowerPoint?
Yes. Go to Insert > Chart > Bar. Then, choose your favorite 3D bar chart: 3-D Clustered Bar, 3-D Stacked Bar, or 100% 3-D Stacked Bar.
How do I edit the data in an existing bar chart?
- Click your bar chart. This will make the “Chart Design” and “Format” tabs visible.
- Go to the Chart Design tab, find the Data group, and click Edit Data.
- Choose to edit the data in PowerPoint or Excel.
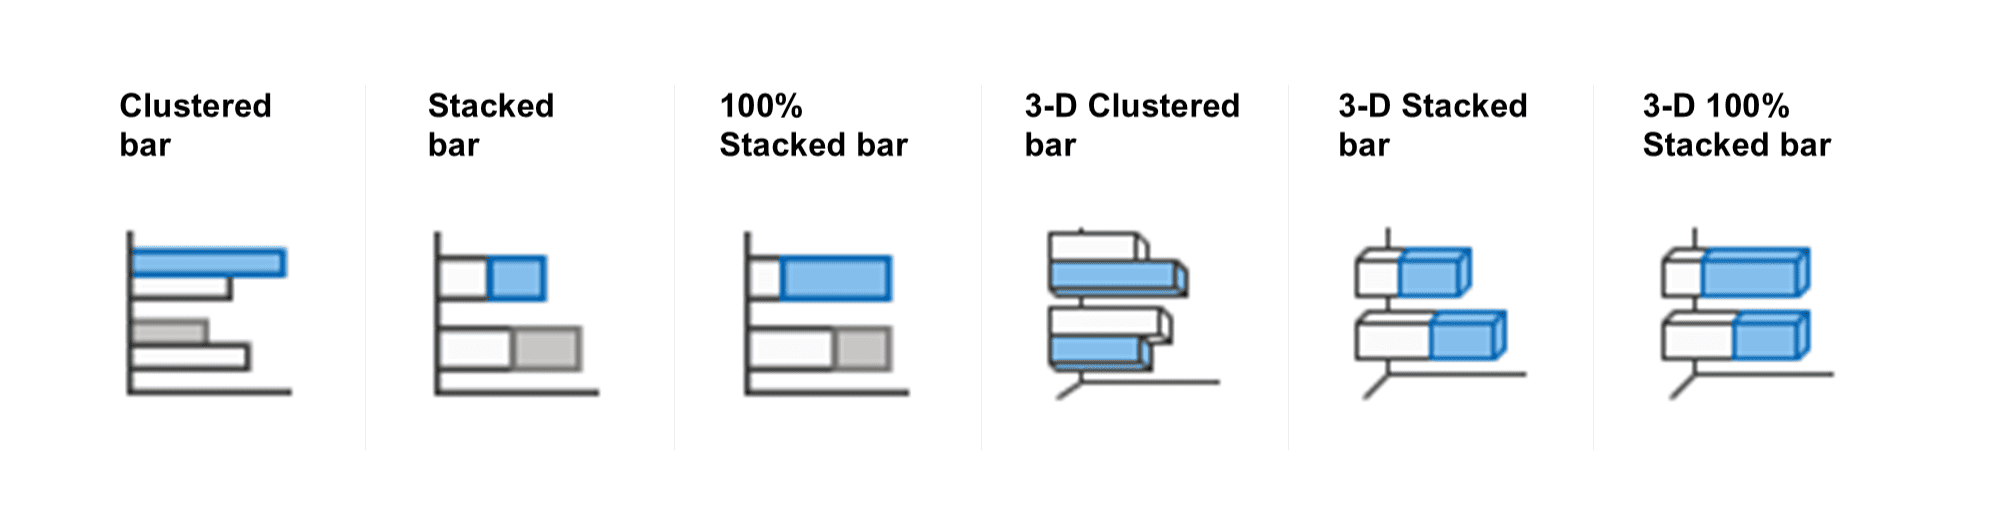
What are the different types of bar graphs I can create in PowerPoint?
- Clustered bar: They help compare values across categories and use a 2D format.
- Stacked bar: Use 2D bar charts to show how individual items contribute to the whole.
- 100% Stacked bar: Displays the percentage that each value contributes to the total. Each bar represents 100%, with segments showing the proportions in 2D.
All these bar charts have a 3D version. The bars appear three-dimensional for visual effect but don’t add data since they don’t use a depth axis.
How can I add animations to my bar chart in PowerPoint?
- Step 1: Select your bar chart.
- Step 2: Open the Animations tab in the PowerPoint ribbon.
- Step 3: Click Add Animation.
- Step 4: Pick an animation effect.
- Step 5: Click Effect Options to adjust the animation effect.
- Step 6: Use the Animation Pane to set timing, duration, and order.
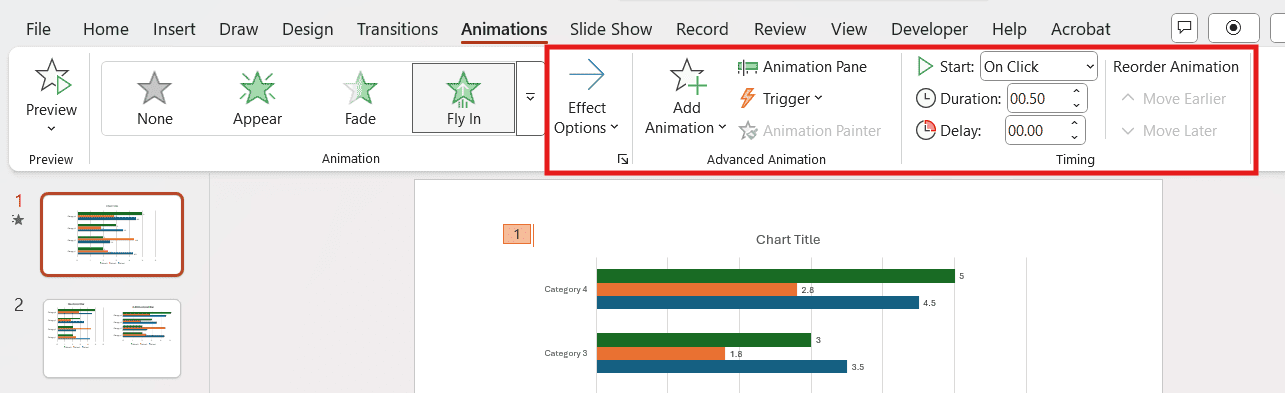
Tip: For a staggered effect, choose "By Element in Series" in Effect Options. This animates each bar one by one.
Take your presentations to the next level with 24Slides
Adding a bar chart in PowerPoint is an easy way to make complex information easy to understand. However, mastering the art of presenting data takes more time and effort. If you still struggle to communicate your message effectively, 24slides is here to help.
With over 12 years of expertise, we’re the world’s largest presentation design company.
At 24Slides, we transform ordinary slides into professional, impactful presentations. In 24 hours, you will receive a presentation that not only looks great but also effectively conveys your message.
The great news? You can enjoy all this magic for just $1. Yes, you read that correctly; you will receive a custom, editable, one-slide presentation tailored to your brand for only one dollar.

Want to improve your presentations? Here’s how!