Death by "Value-Add": When Your Strategy is an Eye Exam, Not a Slide

Stop Designing Eye Exams: The Hidden Cost of "More is More"
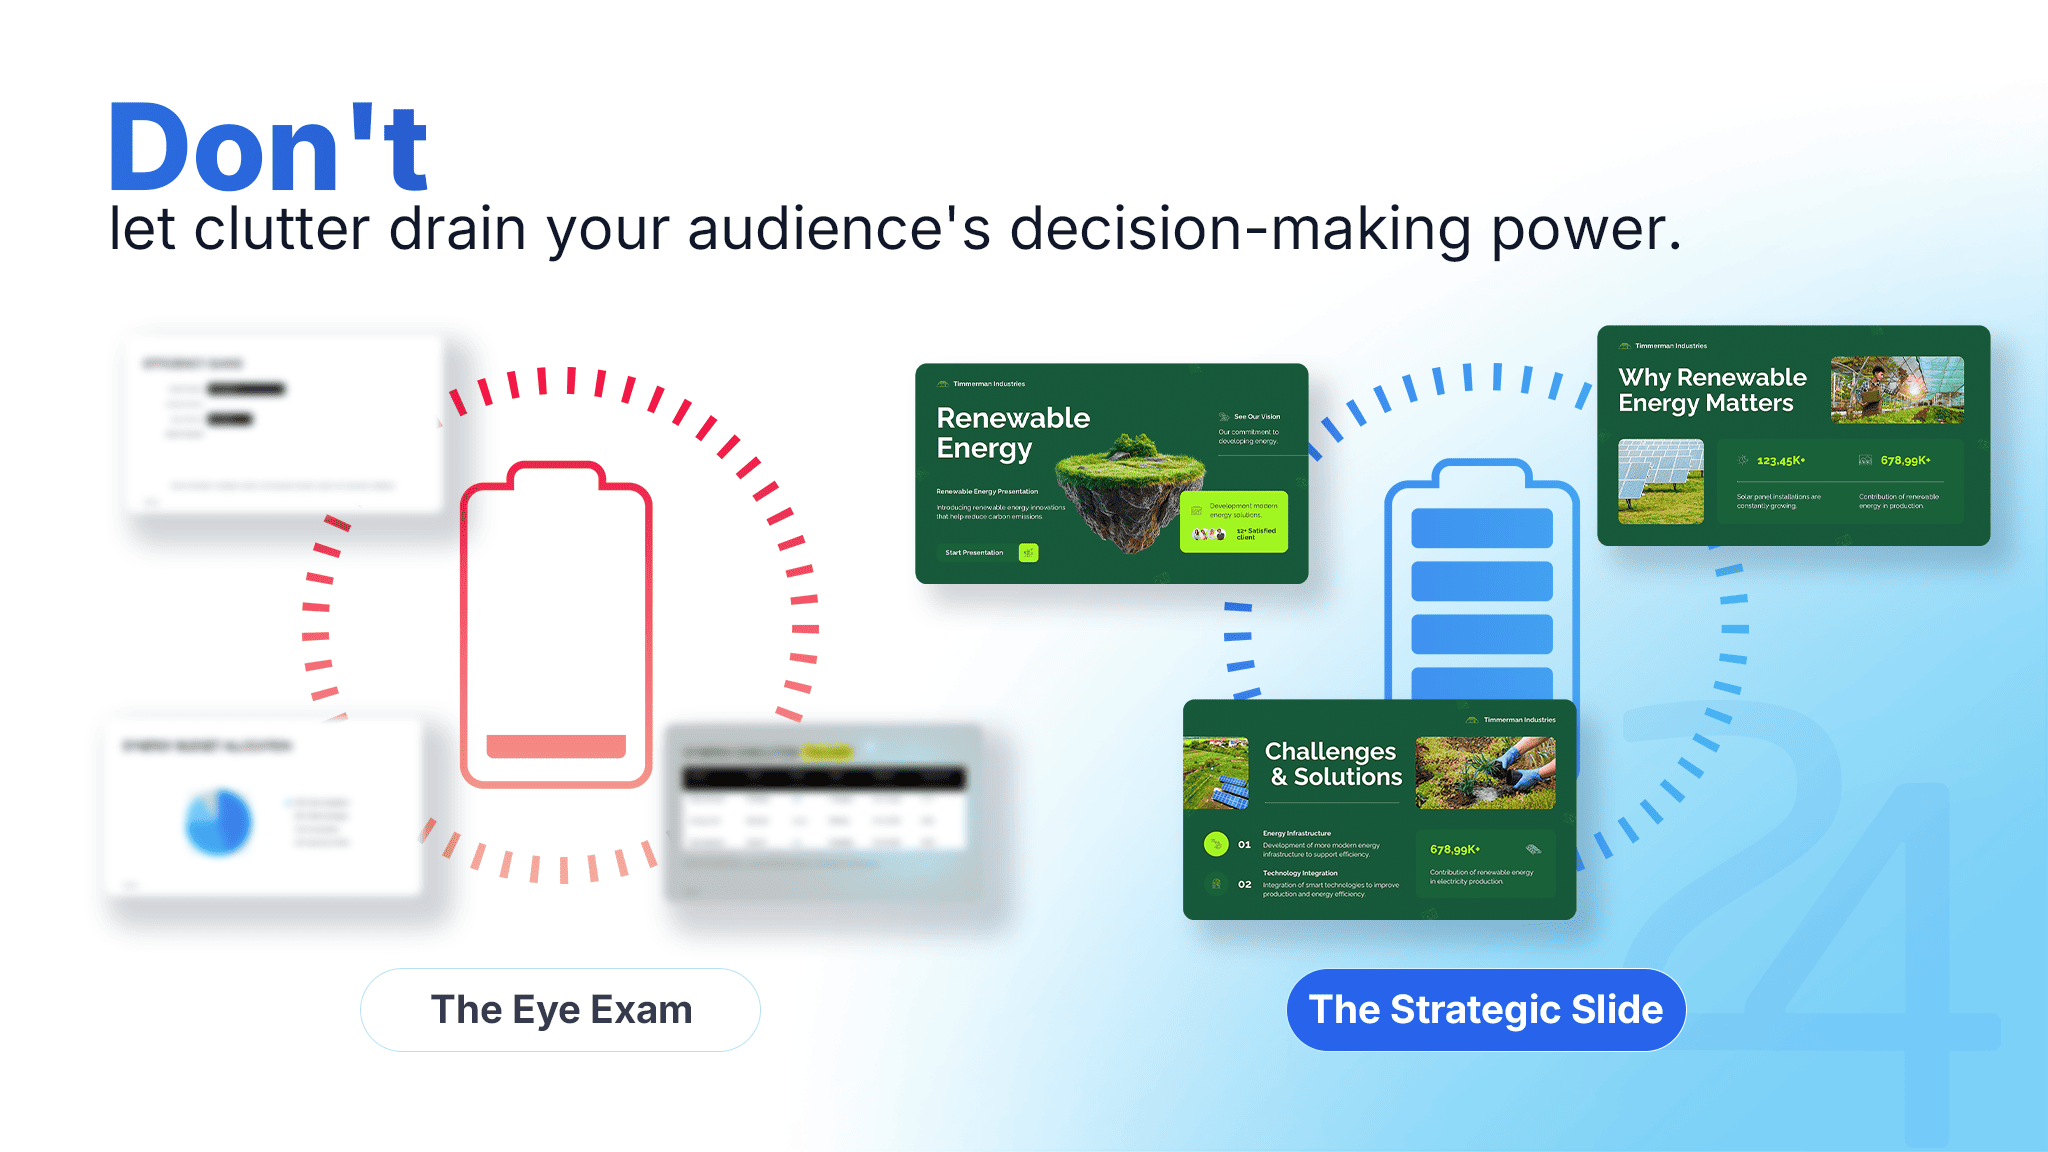
The "More is More" philosophy is a trap. Executives often try to fit a 40-point list onto a single layout to prove their value.
If your audience needs a telescope to read your slide, you haven't designed a presentation. You have designed an eye exam that increases reading time and kills focus.
More info doesn't mean more value; it means more people checking their phones. This visual clutter immediately destroys your Visual Authority in the room.
A professional multimedia presentation should guide the eye, not overwhelm it. When you force people to squint, you lose the "Truth Test" of your leadership.
The Psychology of Passive Communication in Presentations
Data-dumping isn't a "value-add"; it is a symptom of passive communication. It occurs when a presenter abdicates their leadership role and hopes the data will do the talking for them.
According to research on Cognitive Load Theory by the NSW Department of Education, the human working memory is limited to only 4 to 7 items at once. When you create an "eye exam" slide, the "Extraneous Load" (the effort of filtering your clutter) consumes the mental energy your audience needs for the "Germane Load," or the actual synthesis of your strategy.
When you fill a slide with raw data, you are forcing your audience to do the heavy lifting. You are asking them to filter, prioritize, and interpret the data on their own time, a failure of leadership that leads to immediate information loss.
Data from the Stanford Graduate School of Business reveals that information wrapped in a narrative is 22 times more memorable than raw facts alone. Without a clear story, you aren't actually presenting; you are simply providing a backdrop for confusion that your audience will forget the moment they leave the room.
True leadership requires active presentation techniques. You must mitigate the "Split-Attention Effect," a psychological phenomenon in which an audience's focus is fractured as they struggle to switch between a complex diagram and a speaker’s words.
Leading the room requires making the difficult choices about what stays and what goes. By integrating your visuals and your voice, you provide the active guidance necessary to ensure your audience doesn't have to "switch" focus and lose interest.
Why Your Layout is a Figurative Statement of Your Strategic Clarity
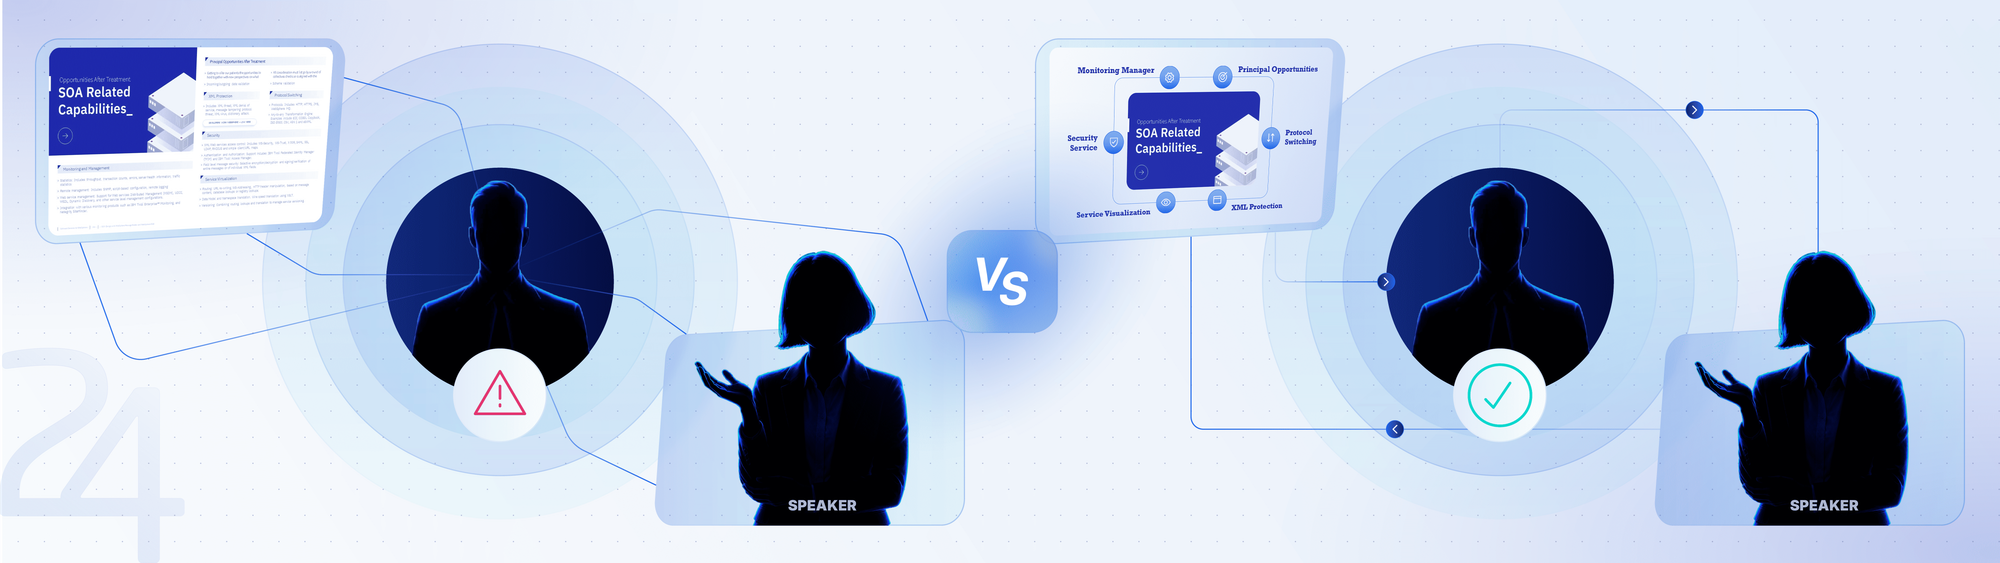
Your slide layout is more than just a background for your data; it is a figurative statement of your leadership. In high-stakes environments, the audience uses your visual organization as a proxy for your strategic organization.
A chaotic "eye exam" acts as a figurative speech that signals internal disorganization. If you cannot prioritize the information on a single slide, your audience subconsciously assumes you cannot prioritize the goals of your department or company.
This isn't just a "hunch", it is backed by the Coherency Effect. According to research published in PubMed by Gunwan et al., audiences show a significantly more positive attitude and a higher willingness to interact with "coherent" narrators.
When a presenter fails to theme their data, the social and cognitive response from the audience drops. The study confirms that listeners check out or provide less support when faced with "slides that have too many words" because the narrator appears incoherent.
By applying professional presentation techniques, you ensure your deck doesn't look like an accident. Clean design proves you have mastered your subject enough to distill it, signaling high-level strategic competence.
How to Get People to Listen to You: From Reading to Leading
To master how to get people to listen to you, you must stop giving them something to read while you are talking. Human brains cannot read and listen simultaneously, so every word on your slide is a direct competitor for your audience's attention.
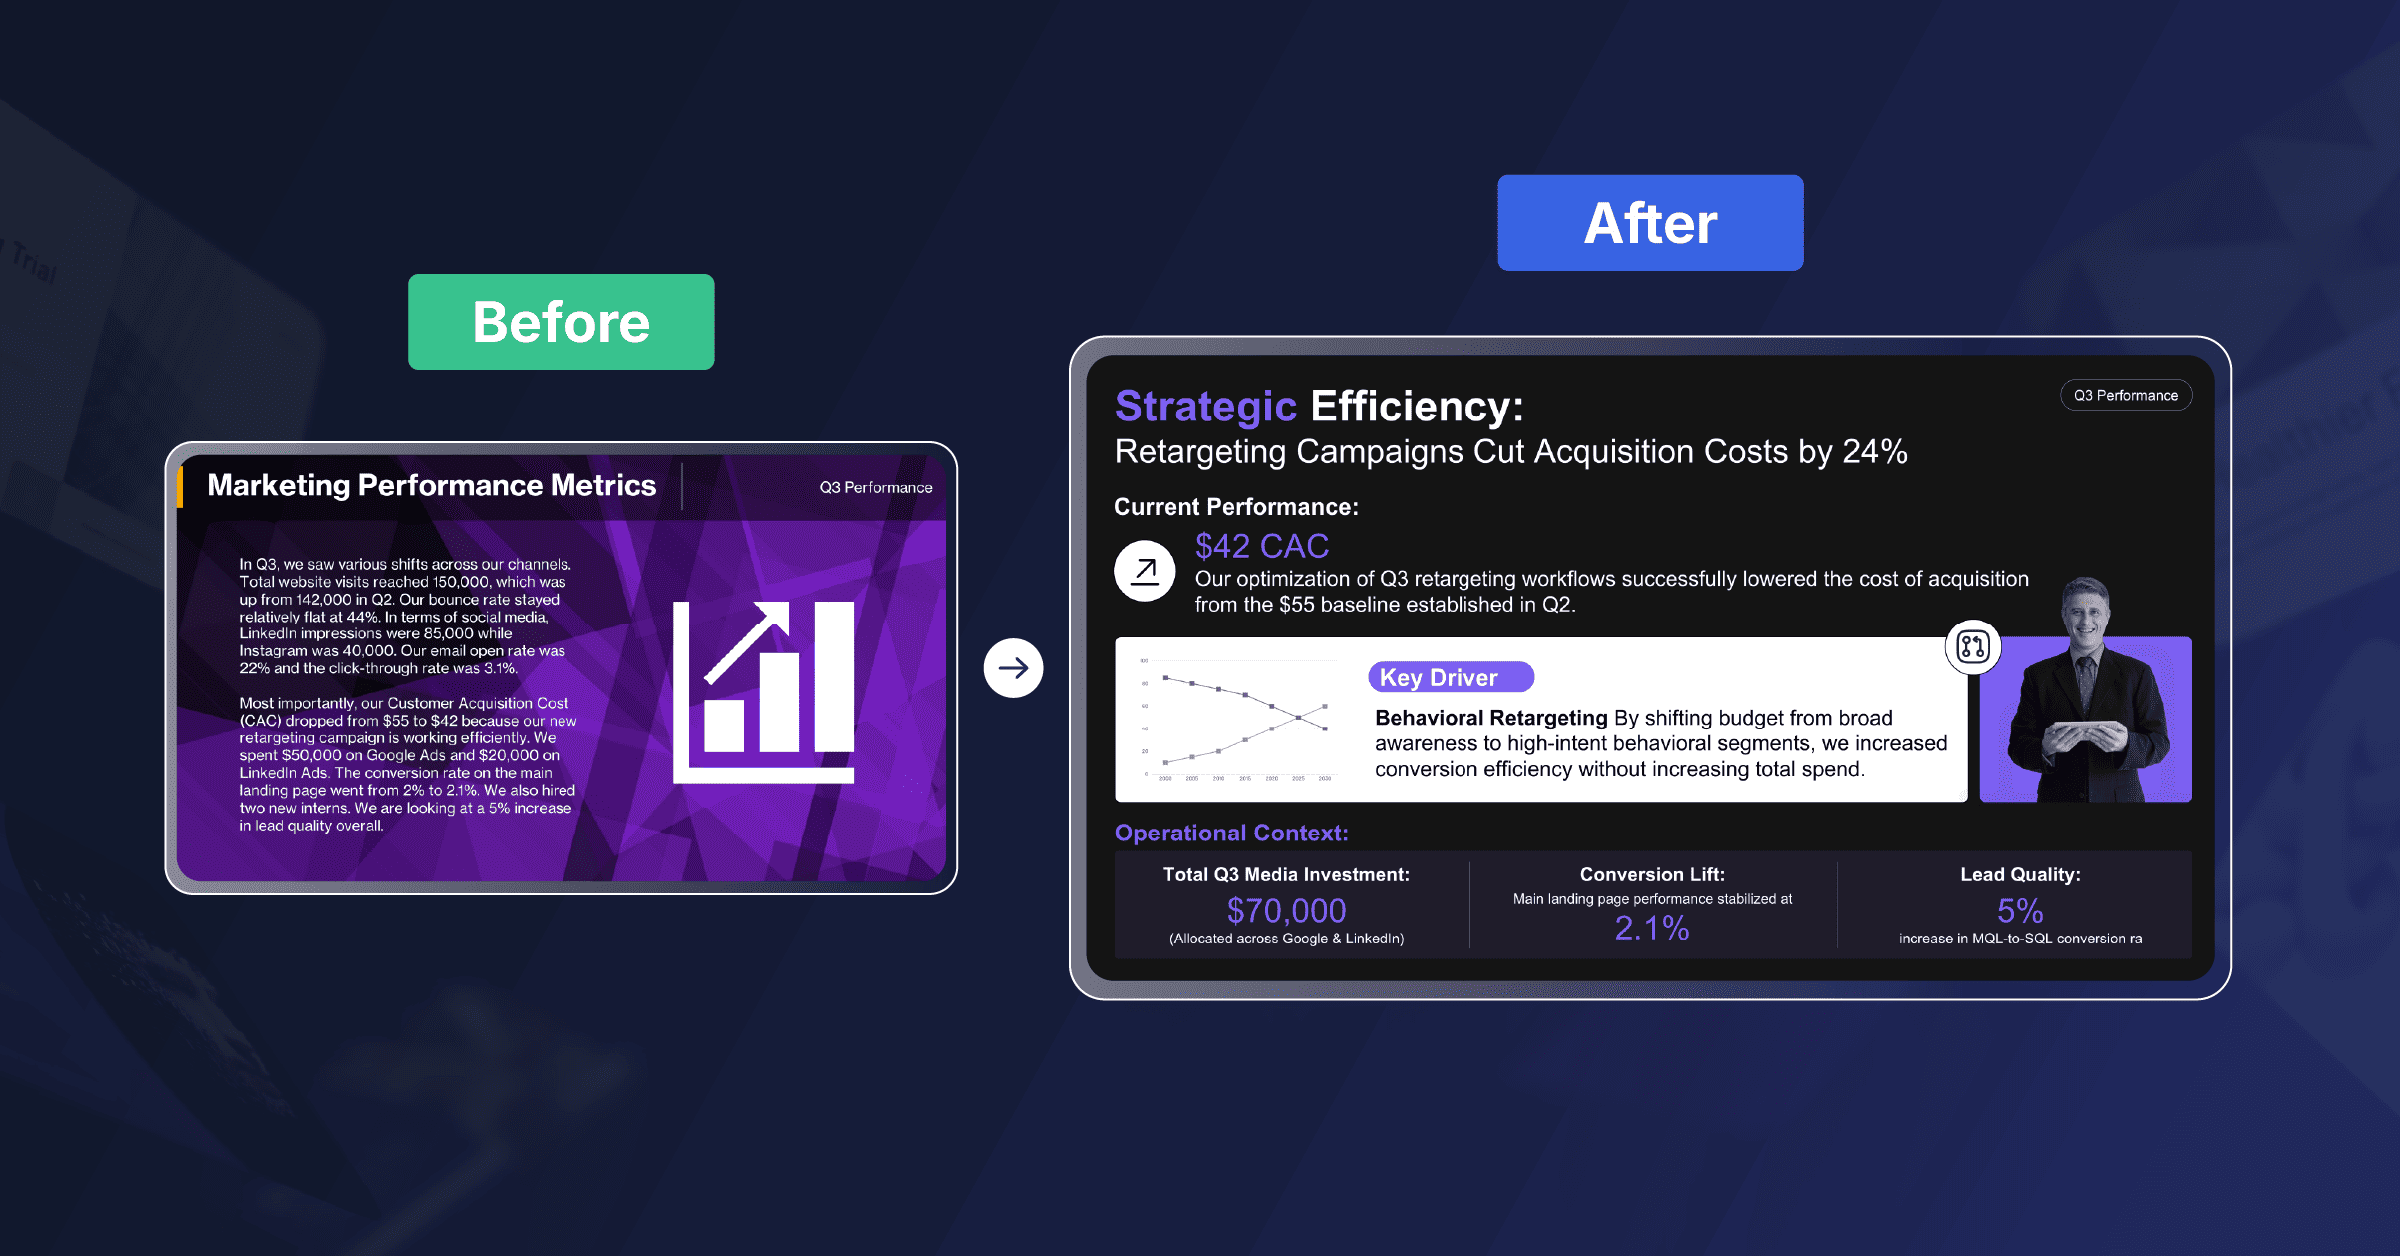
The goal is to shift your deck’s purpose from a "data dump" to a visual executive summary. Your slides should not be the presentation itself; they should be the evidence that supports the narrative you are delivering.
By implementing specific presentation techniques, you reclaim the role of the narrator. Instead of overwhelming the room with an "eye exam," you use your visuals to punctuate your points and guide the audience toward your conclusion.
- Distill 40 points into 1 core insight: If the audience has to hunt for the point, they’ve already stopped listening to you.
- Use white space as a tool, not a "waste": Negative space directs the eye to what actually matters and prevents cognitive overload.
- Prioritize visual hierarchy over font density: Use size, color, and placement to show the audience what to care about first.
Solving the Design Bottleneck with Design Ops
Most leaders don’t create "eye exams" on purpose; they do it because they hit a design bottleneck. When you are crushed by deadlines, it is faster to dump text onto a slide than it is to spend hours distilling it into something scannable.
To fix this, you need Design Ops, an operational system that treats slide creation as a professional workflow rather than a late-night chore. This framework offloads the visual heavy lifting so you can focus on your narrative.
Through Visual Storytelling, a mess of data is transformed into Creative Infographics that reveal insights at a glance. To get the best results from a professional slide design company, you should provide a few "visual cues" to help them highlight your priorities:
- The 10% Rule: Explicitly tag or highlight the top 10% of data points that directly prove your strategic point.
- The "So What?" Anchor: Instead of a generic title like "Sales Data," provide the insight you want the designer to emphasize, such as "20% Growth in Q4."
- Hierarchical Guidance: Use simple bolding in your draft to tell the "visual architect" which numbers need to be the biggest on the page.
While a design partner won't rewrite your content, they act as your visual filter. By giving them clear priorities, they ensure your Visual Authority remains intact, turning your complexity into a clear strategic advantage.
From "Word-Vomit" to Open Ended Questions
The ultimate goal of any presentation is to move the audience from reading to reacting. When you eliminate the "word-vomit," you create the mental space for your audience to ask high-level open ended questions.
If your stakeholders aren't squinting at tiny text or decoding an "eye exam," they are finally engaging with your strategy. Clarity allows the room to focus on the "why" and the "how" of your vision, rather than getting stuck on the "what."
Professional design is not a luxury; it is a strategic business driver. Replacing passive communication with visual precision ensures alignment that scales, ultimately contributing to higher Total Returns to Shareholders (TRS).
Strategic Verification & Entity Resources