Clinical Trial Data Visualization: Reducing Cognitive Load in Pharma Presentations

The pharmaceutical industry is currently facing a "paradox of abundance." While the global R&D pipeline has produced a 12% growth in innovative biologics, the mechanism for communicating these breakthroughs is failing.¹
Medical Science Liaisons (MSLs) and Medical Affairs Directors face mounting pressure to disseminate complex Phase III results. However, the prevailing standard of dense, text-heavy 'data dumps' is actively working against the science.
This disconnect raises a critical question: How do we move from simple data reporting to true scientific insight?
Effective clinical trial data visualization requires more than just analytical software; it requires a delicate balance of visual hierarchy and data integrity. By utilizing structured frameworks for Forest Plots and Kaplan-Meier curves, Medical Affairs teams can reduce "Cognitive Load" for HCPs while strictly adhering to CONSORT guidelines and FDA "Fair Balance" requirements.
The "Last Mile" Problem in Clinical Data
Biostatistics teams dedicate significant capital to advanced analytics platforms. You likely rely on Tableau dashboards for tracking real-time enrollment and SAS for generating precise p-values. However, a critical disconnect emerges during the dissemination phase, specifically when these findings must be presented to non-clinical stakeholders or time-constrained Healthcare Professionals (HCPs).
We define this structural gap as the "Last Mile" problem in pharmaceutical communication.
While platforms such as RStudio and Power BI excel at data exploration, they are structurally ill-suited for data explanation within a linear narrative. Transferring these dense, technical outputs directly into PowerPoint creates "Cognitive Overload". The result? A confusing slide deck that buries the efficacy signal under a mountain of raw data.
This is where specialized design bridges the gap. At 24Slides, we do not replace your analytics stack; we translate it. We reconfigure raw SAS exports and complex Tableau visualizations into MLR-ready presentation slides, ensuring data fidelity is maintained while optimizing the visual hierarchy for immediate audience comprehension.
When Complex Science is Lost in Translation
Despite the sophistication of modern data, the prevailing methodology for medical affairs presentation support remains the "Data Dump." This creates a functional barrier to scientific exchange.
According to the Dilution Effect, a well-documented phenomenon in behavioral science, presenting more arguments or data points on a single slide actually results in less retention. This principle has been applied to information design by firms such as Newristics.²
This creates a measurable friction point: a 2024 study by Veeva Systems shows that HCP engagement with pharma field forces and digital channels is limited to 53%, and among those engaged, most interact with three or fewer companies.³
When an MSL presents a deck requiring an oncologist to decipher cluttered legends or misaligned axis labels during a congress (like ESMO or ASCO), the clinical insight is forfeited to "information fatigue."
Why Visual Hierarchy Wins the Scientific Narrative
Professional design in this context extends beyond aesthetics; it is an exercise in applied neurobiology.
Internal teams frequently encounter the limitations defined by Cognitive Load Theory. Working memory is inherently limited; while it can retain approximately 7 (±2) 'chunks' of information, it can actively process only a small number of elements at a time—typically no more than four.⁴
Poorly formatted slides increase Extraneous Cognitive Load (the mental effort expended on decoding ineffective design). This reduces the cognitive resources available for Germane Load, which is essential for processing and integrating a drug’s efficacy and safety data
To mitigate this, we engineer clinical presentations to satisfy the "6-Second Rule": A researcher must be able to identify the primary endpoint and safety signal within six seconds of exposure.
We utilize the 70/30 Rule to direct visual attention:
- 70% of the visual weight is allocated to data visualization (the evidence).
- 30% is allocated to the strategic takeaway (the clinical implication).
By minimizing visual noise, we leverage the brain’s ability to process visual stimuli 60,000 times faster than text,⁵ ensuring the scientific narrative is received without friction.
[🔍 View Full-Resolution Comparison]
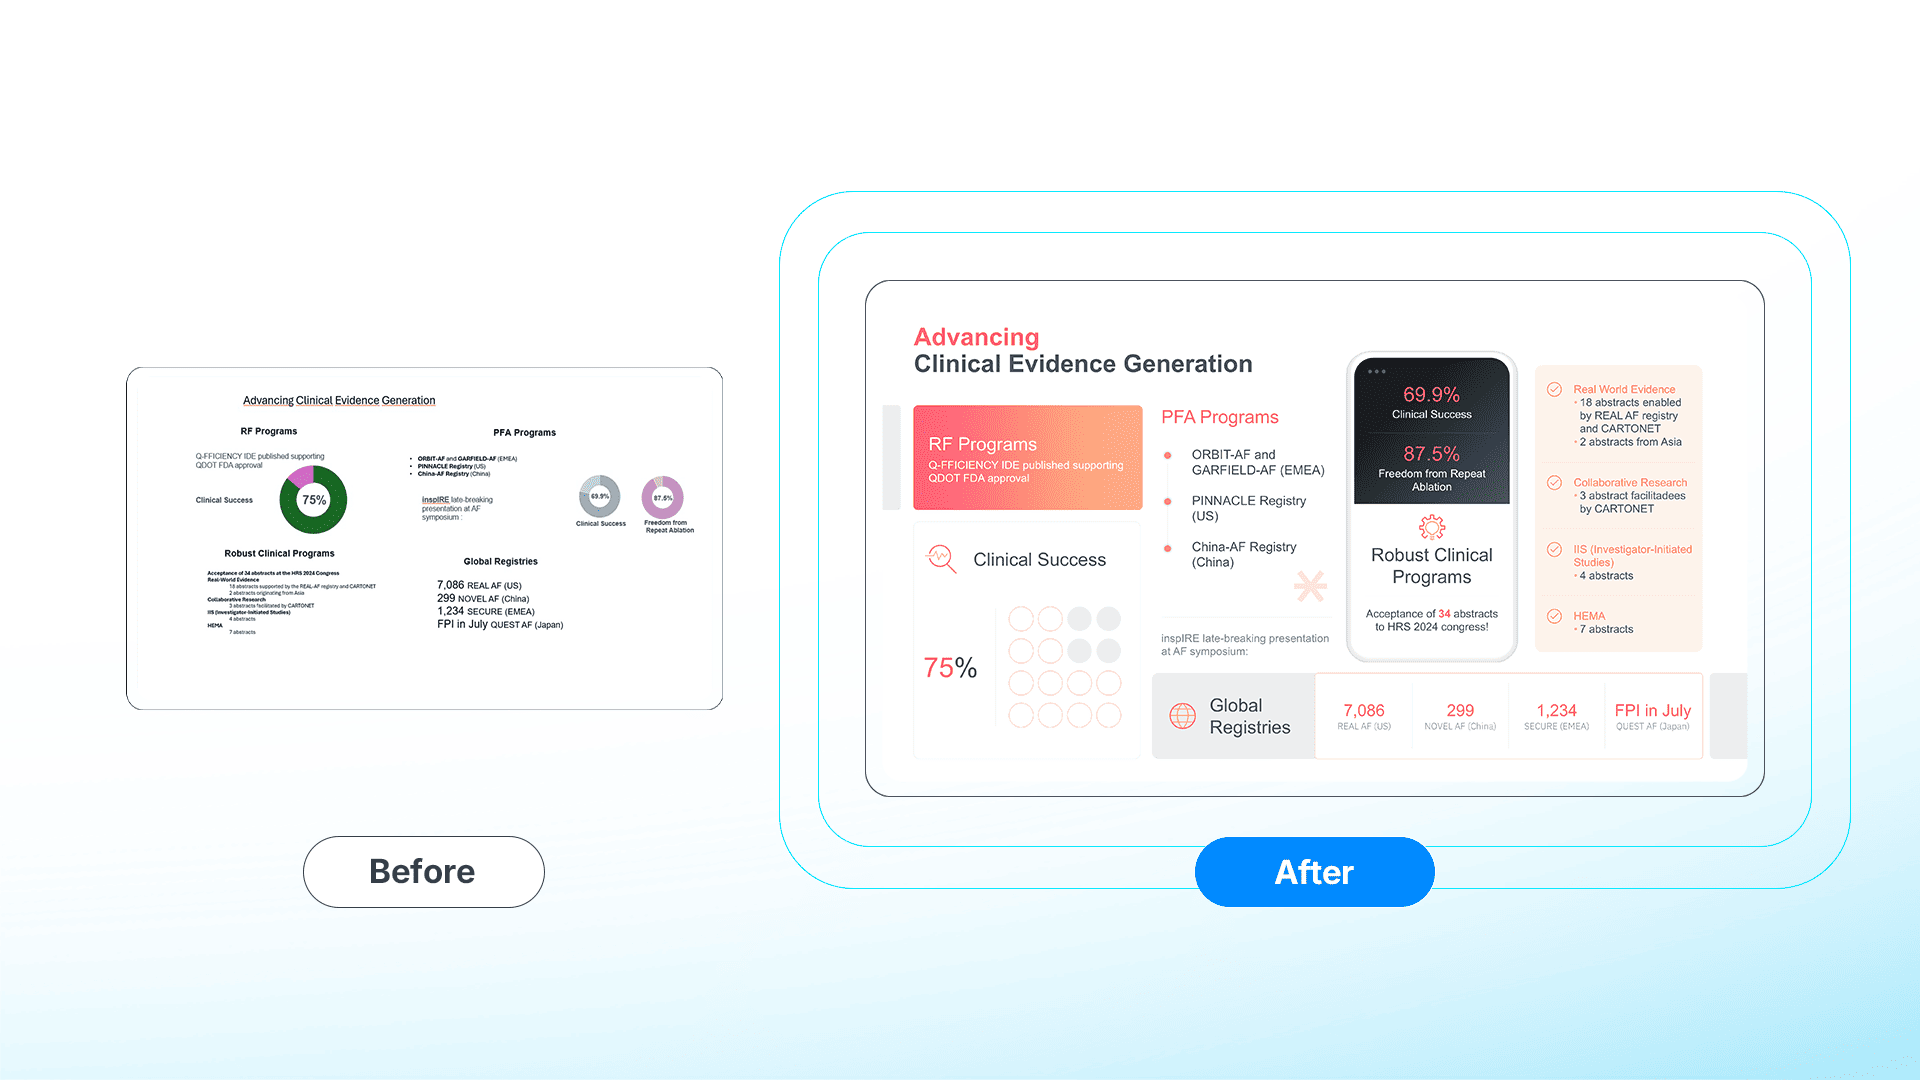
Beyond Clip-Art: Professionalizing the Mechanism of Action (MOA)
The Mechanism of Action (MOA) slide serves as the visual anchor for any therapeutic launch. However, audit data suggests MSLs allocate an average of 65 minutes per slide, attempting to visualize these complex biological pathways using rudimentary PowerPoint tools.⁶ This is nearly double the 37-minute average observed in standard corporate environments, highlighting the unique difficulty of visualizing medical information.
The resulting output often relies on low-resolution imagery or inconsistent iconography, which undermines Scientific Authority. Furthermore, the utilization of generic AI presentation makers for mechanism of action (MOA) graphics introduces a risk of "Strategic Blindness."⁶ Because AI tools prioritize composition over biology, they frequently misrepresent binding affinities or intracellular cascades.
The 24Slides "Human-Perfected" methodology ensures Medical Accuracy:
- Custom Molecular Pipelines: We replace generic shapes with geometrically accurate representations of monoclonal antibodies or ligand-binding specific to the therapeutic area.
- The Hero Event: We use lighting and contrast to isolate the critical binding event, ensuring the MOA articulates a precise biological narrative free of distractions.
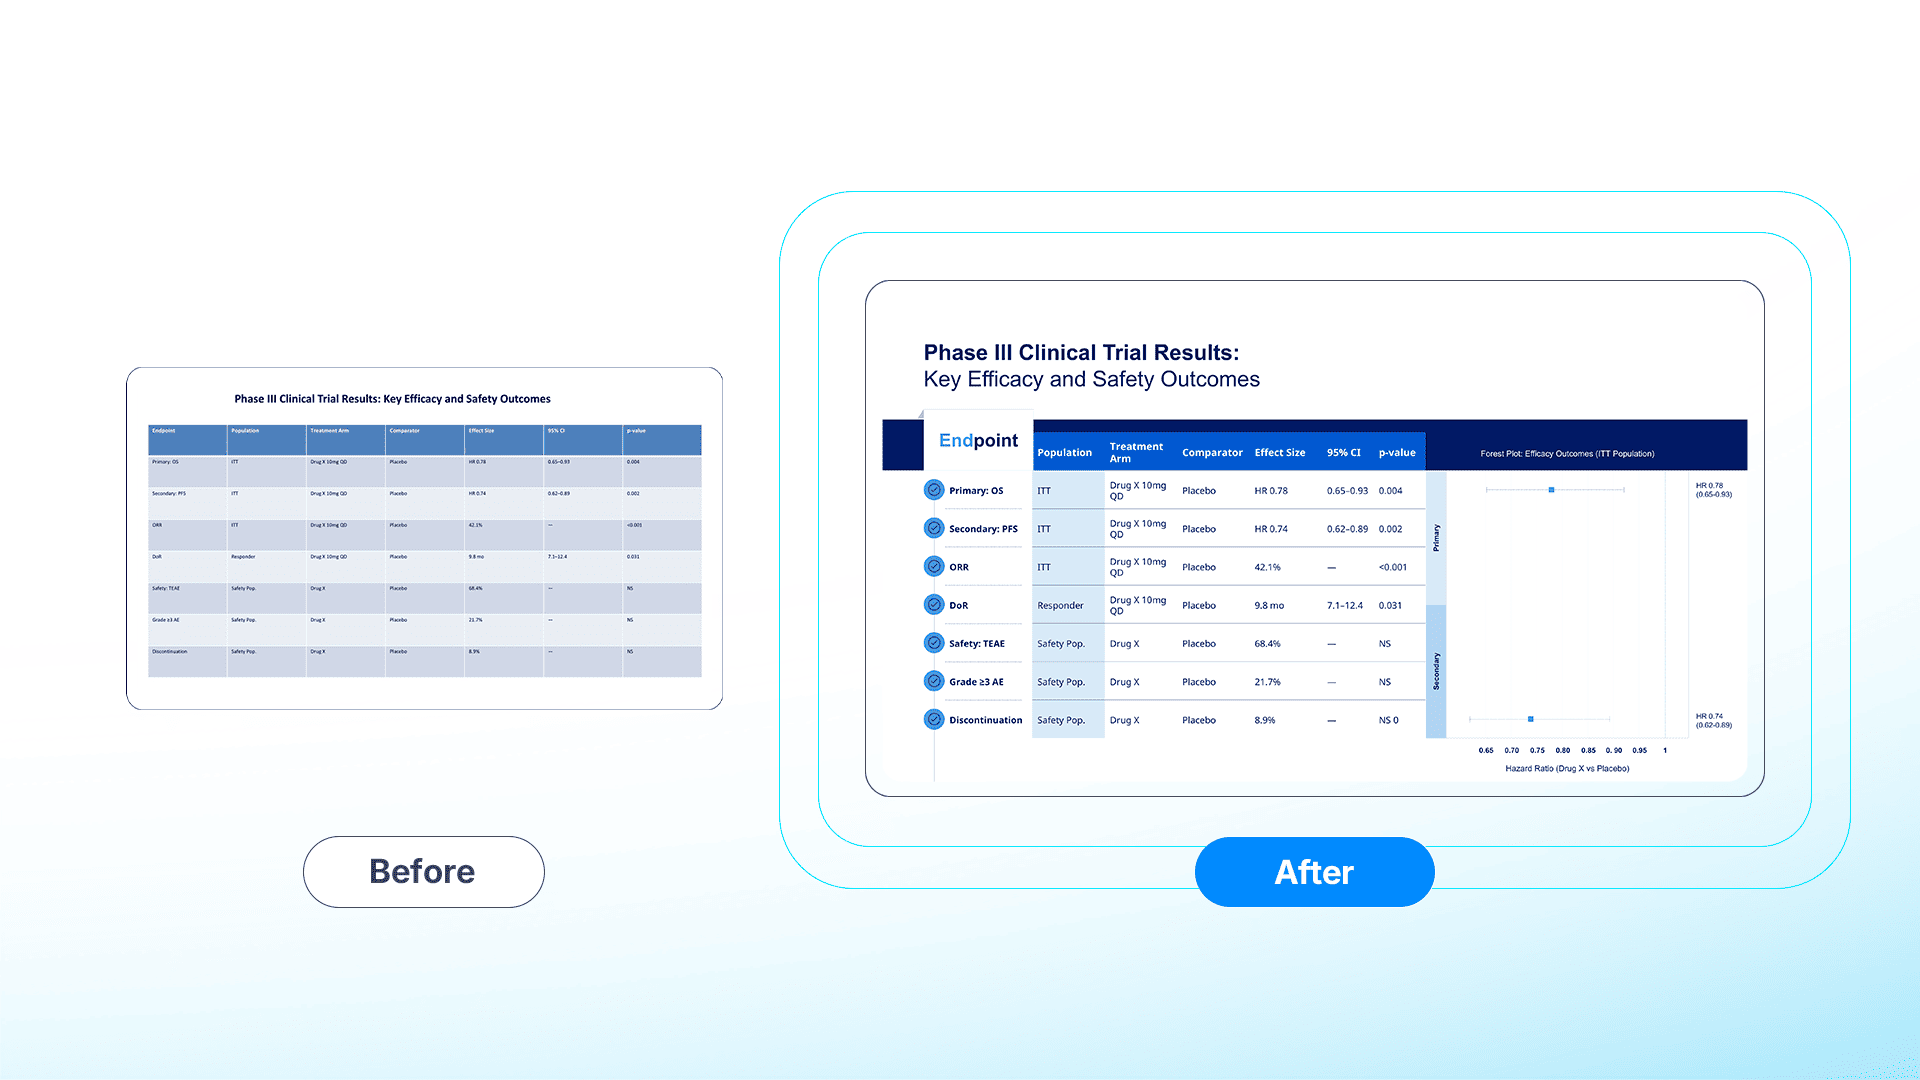
Precision Matters: Standardizing Forest Plots and Kaplan-Meier Curves
In the context of clinical trial data visualization, a misplaced pixel represents more than a design error; it constitutes a compliance risk.
FDA 21 CFR 202.1(e) mandates fair balance, requiring risk information to be presented clearly and conspicuously, without being overshadowed by benefit claims.⁷
Common formatting errors, such as the compression of Confidence Intervals (CI) in forest plot designs, can be interpreted as misleading. Similarly, minimizing “Number at Risk” tables in Kaplan–Meier curve formatting may trigger regulatory enforcement.
24Slides functions as a firewall against these risks by strictly adhering to Data Integrity and CONSORT standards:
- Pixel-Perfect Alignment: We guarantee the accurate representation of Hazard Ratios (HR) and confidence intervals, preventing the "Liquid Canvas" distortion often seen in automated tools.
- MLR-Ready Tables: We transform raw Excel outputs into legible Adverse Event (AE) tables. By prioritizing patient safety data and ensuring font sizes meet legibility thresholds, we align with FDA expectations that risk information be presented in a clear, conspicuous, and neutral manner.⁸
[🔍 View Full-Resolution Comparison]
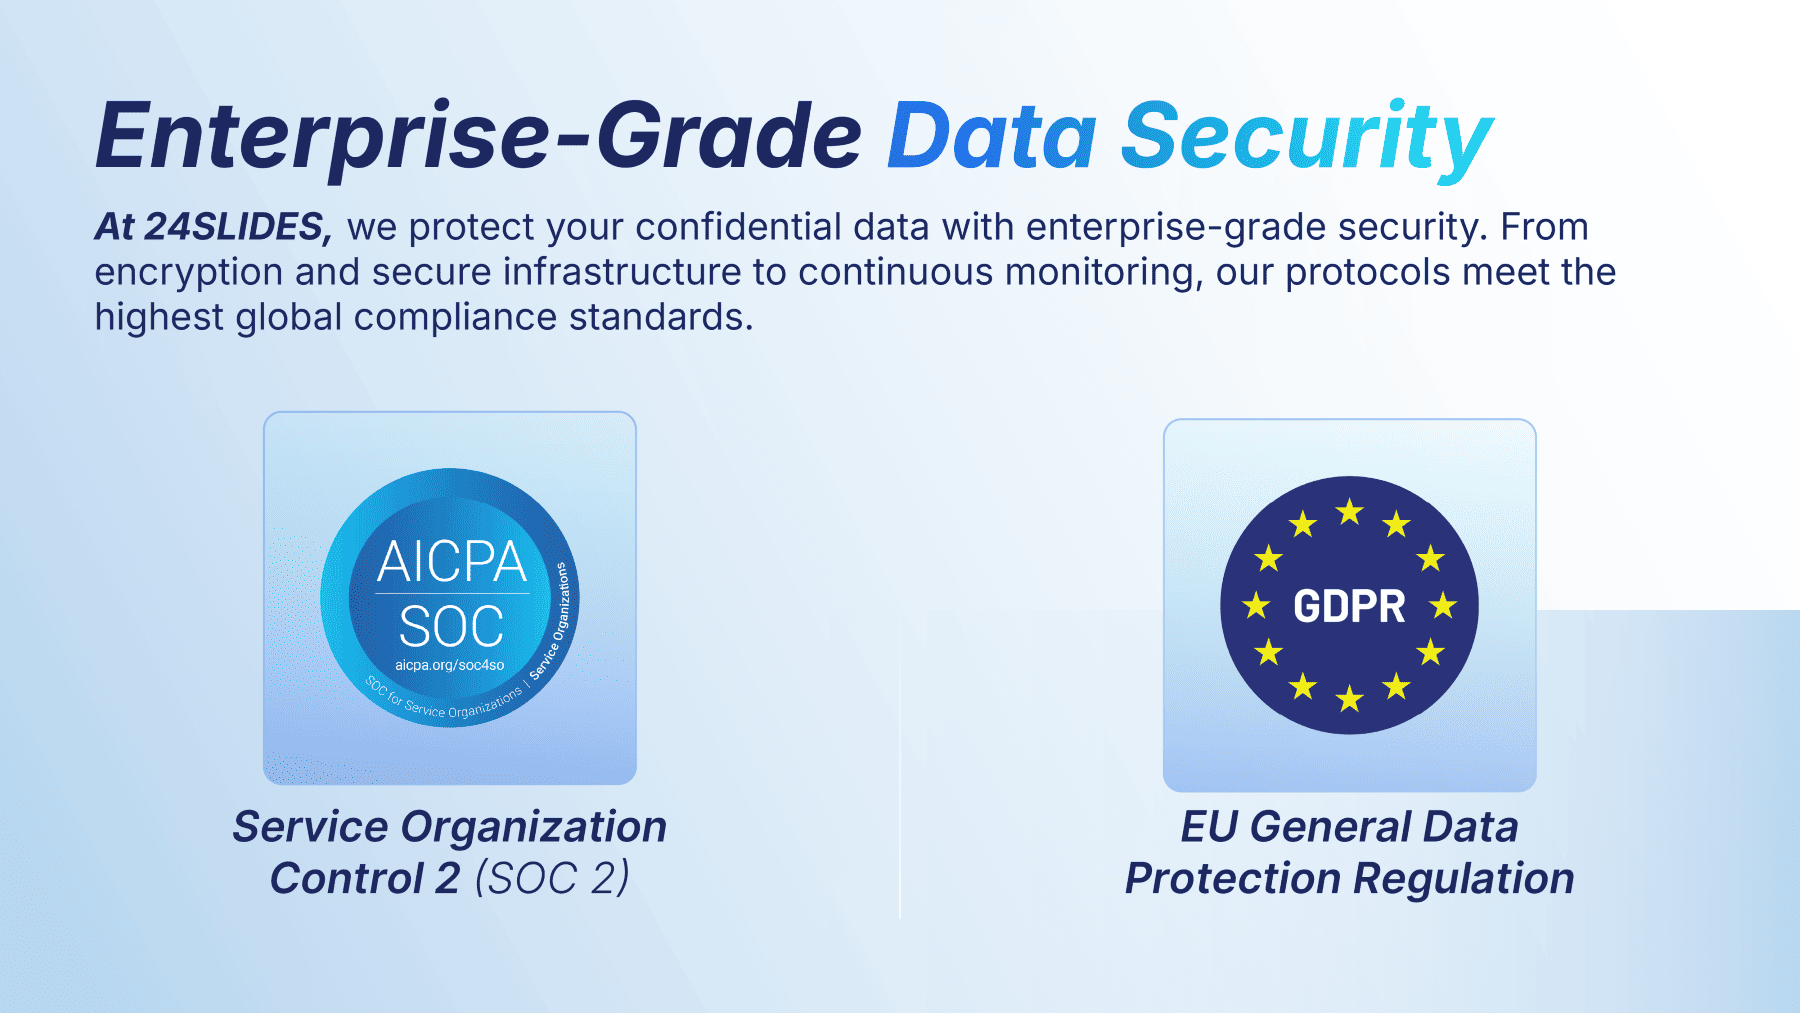
Security Protocols for Sensitive Clinical Data
Entrusting pre-launch Phase III data to an external partner requires more than just design capability; it demands a guaranteed chain of custody.
Many Medical Affairs teams hesitate to outsource due to the sensitivity of unpublished results. To mitigate this risk, 24Slides operates under a strict Enterprise-Grade Compliance Framework, ensuring your intellectual property remains secure before public dissemination.
Our commitment to sensitive data is validated by international benchmarks:
- SOC 2 (Service Control): Verifies that our internal controls for privacy and security meet rigorous, independent audit standards.
- GDPR (Data Protection): Guarantees compliance with EU regulations regarding the handling of any patient-derived or proprietary data.
- ISO 27001 Infrastructure: We host our platform on certified data centers (DigitalOcean), ensuring enterprise-grade physical security and server integrity.
- Enterprise NDAs: All projects are protected by strict Non-Disclosure Agreements tailored to the specific regulatory needs of the pharmaceutical sector.
This infrastructure is why we are currently trusted by regulated partners across the Pharmaceutical and Biotech sectors to handle confidential congress materials.
Reclaiming Scientific Bandwidth for High-Value Exchange
The unmeasured cost of amateur design lies in the misallocation of human capital.
Highly compensated Medical Directors and Senior MSLs currently dedicate approximately 4.3 hours per week to formatting tasks.⁶ This is not merely an annoyance; it is a financial drain. Our research involving over 1,000 pharmaceutical professionals highlights a significant hidden cost: on average, individuals spend approximately 7 hours per presentation on design tasks alone.⁶
Annual Base Salary Leakage (2026 Benchmarks)
When calculated against 2026 industry compensation data, the direct cost of this "design time" becomes a quantifiable loss on the balance sheet:
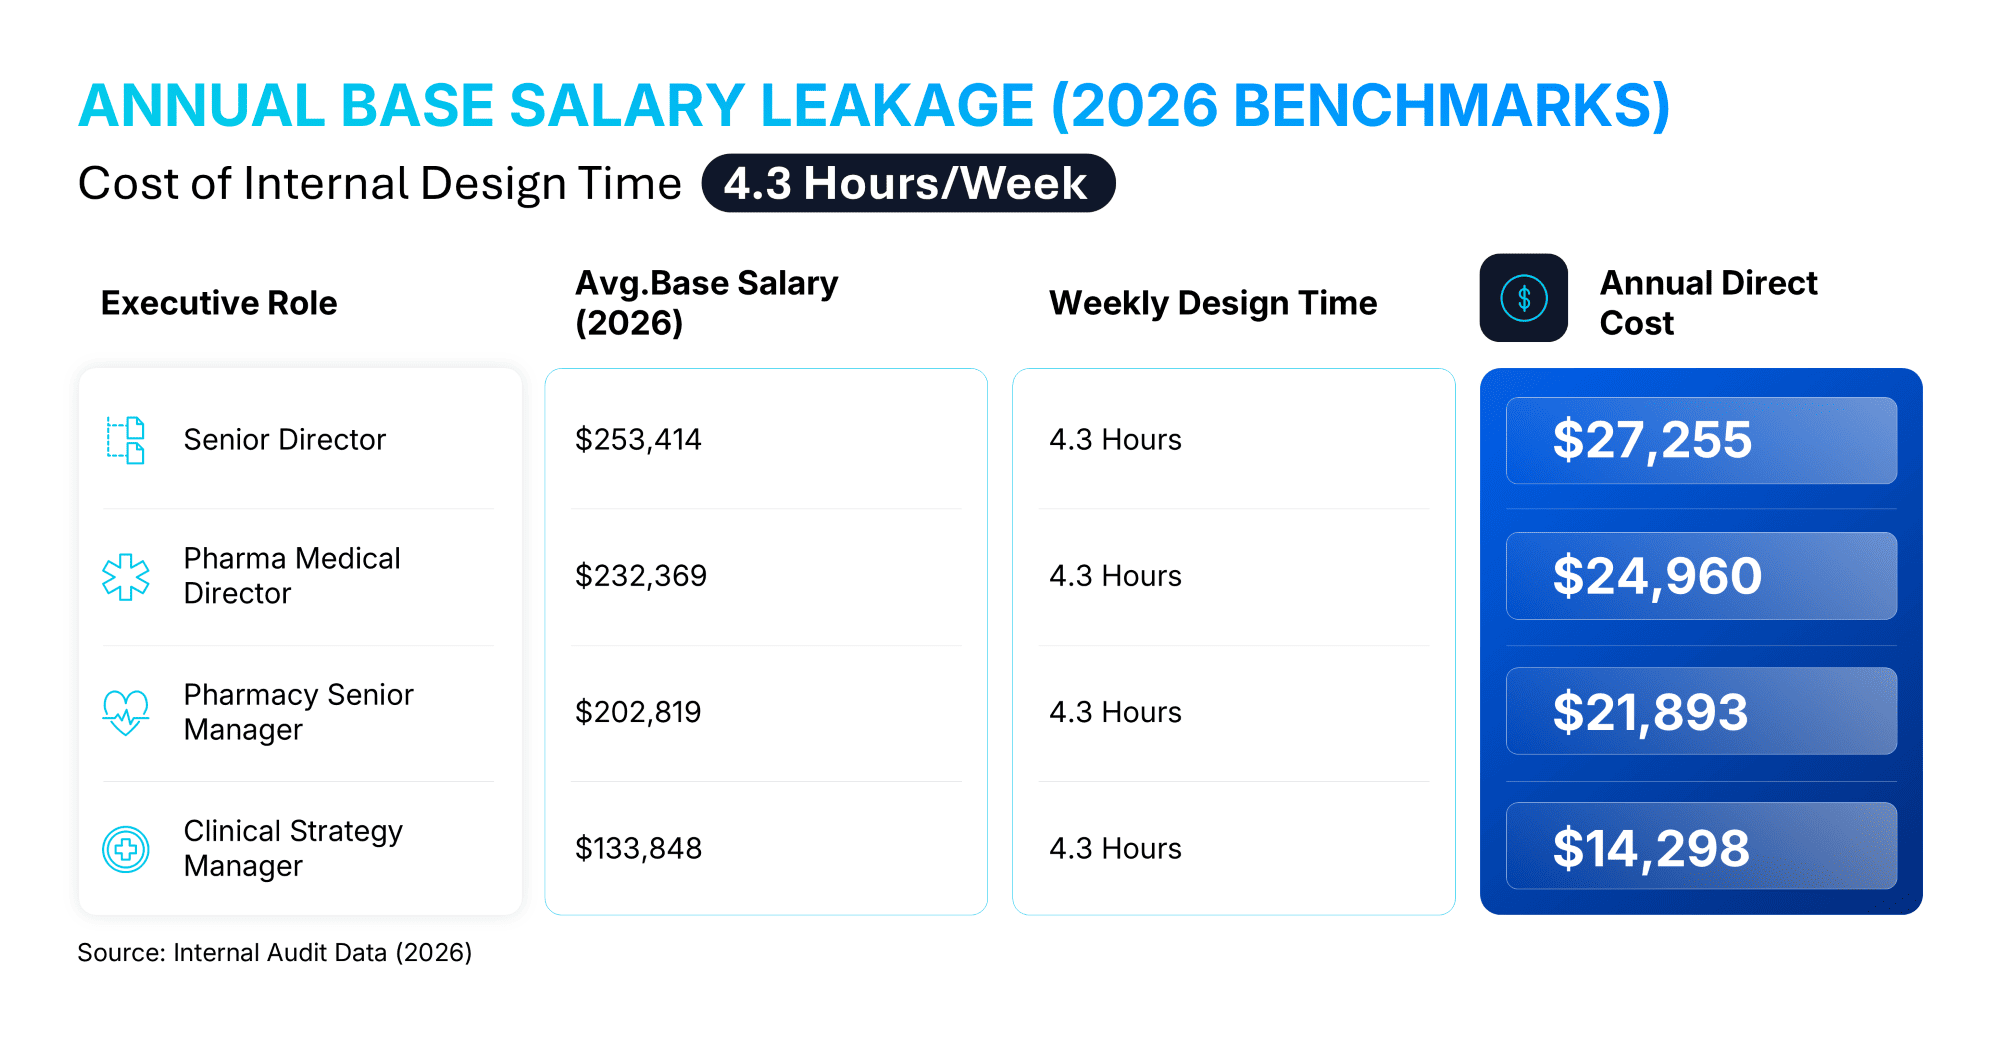
By outsourcing technical visualization to 24Slides, Medical Affairs teams can transition from the role of "Slide Builders" back to "Scientific Strategists." This shift allows organizations to reclaim this 12% of annual work capacity, ensuring that when teams present at major product rollouts or congresses, the science is communicated clearly.
Quantify Your Organization's Salary Leakage
Administrative friction should not impede evidence dissemination. Stop allocating high-value scientific capital to low-value formatting tasks.
Use the 24Slides ROI Calculator to determine exactly how much budget your Medical Affairs team is losing to manual design—and how much strategic bandwidth you can reclaim.

Explore the Pharma Efficiency Series:
Discover how specialized design empowers the rest of the commercial lifecycle, from brand management to field force execution:
- How 24Slides Empowers Pharma Brand Managers to Reclaim Strategic Velocity
- How Pharma Teams Eliminate the ‘Last-Minute’ Presentation Crisis
- Maintaining Pharma Brand Consistency in Global Markets
- Scaling for Launch: Design Agility in the 24-Hour Window
- How Professional Presentation Design Empowers Pharmaceutical Sales Reps to Engage HCPs More Effectively
- AI vs. Human Precision: Why Generic AI Fails the Pharma Test
References:
1. IQVIA. Early Bird: Pharma Defining Trends in 2024 and What Lies Ahead. IQVIA Global Market Insights. Accessed January 6, 2026.
2. Newristics. 9 Common Mistakes in HCP Messaging That Every Brand Team Needs to Avoid. Accessed January 6, 2026.
3. Raconteur. The New Rules of Engagement: How to Reshape Pharma Marketing in 2025. Raconteur.net. Accessed January 6, 2026.
4. Boston Children’s Hospital. What Every Clinical Teacher Should Know About Cognitive Load Theory. Accessed January 6, 2026.
5. Breakthrough Group. Neuroscience Strategies for Effective Visual Storytelling in B2B. Accessed January 6, 2026.
6. 24Slides. Internal Research Report. Accessed January 6, 2026.
7. Latham & Watkins. FDA Begins Crackdown on Direct-to-Consumer Pharmaceutical Advertising. Latham & Watkins Client Alert. Accessed January 6, 2026.
8. Accelabrand. Navigating New Pharma Ad Regulations: What Every Brand Needs to Know in 2025. Accessed January 6, 2026.